


 29 / 228

Infrastructure Financing through Islamic
Finance in the Islamic Countries
13
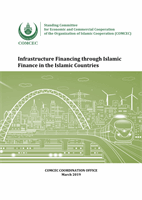
Chart 1.4: Spending Needs for Economic Infrastructure, 2017-35 (USD trillion)
Source: McKinsey (2017: 2)
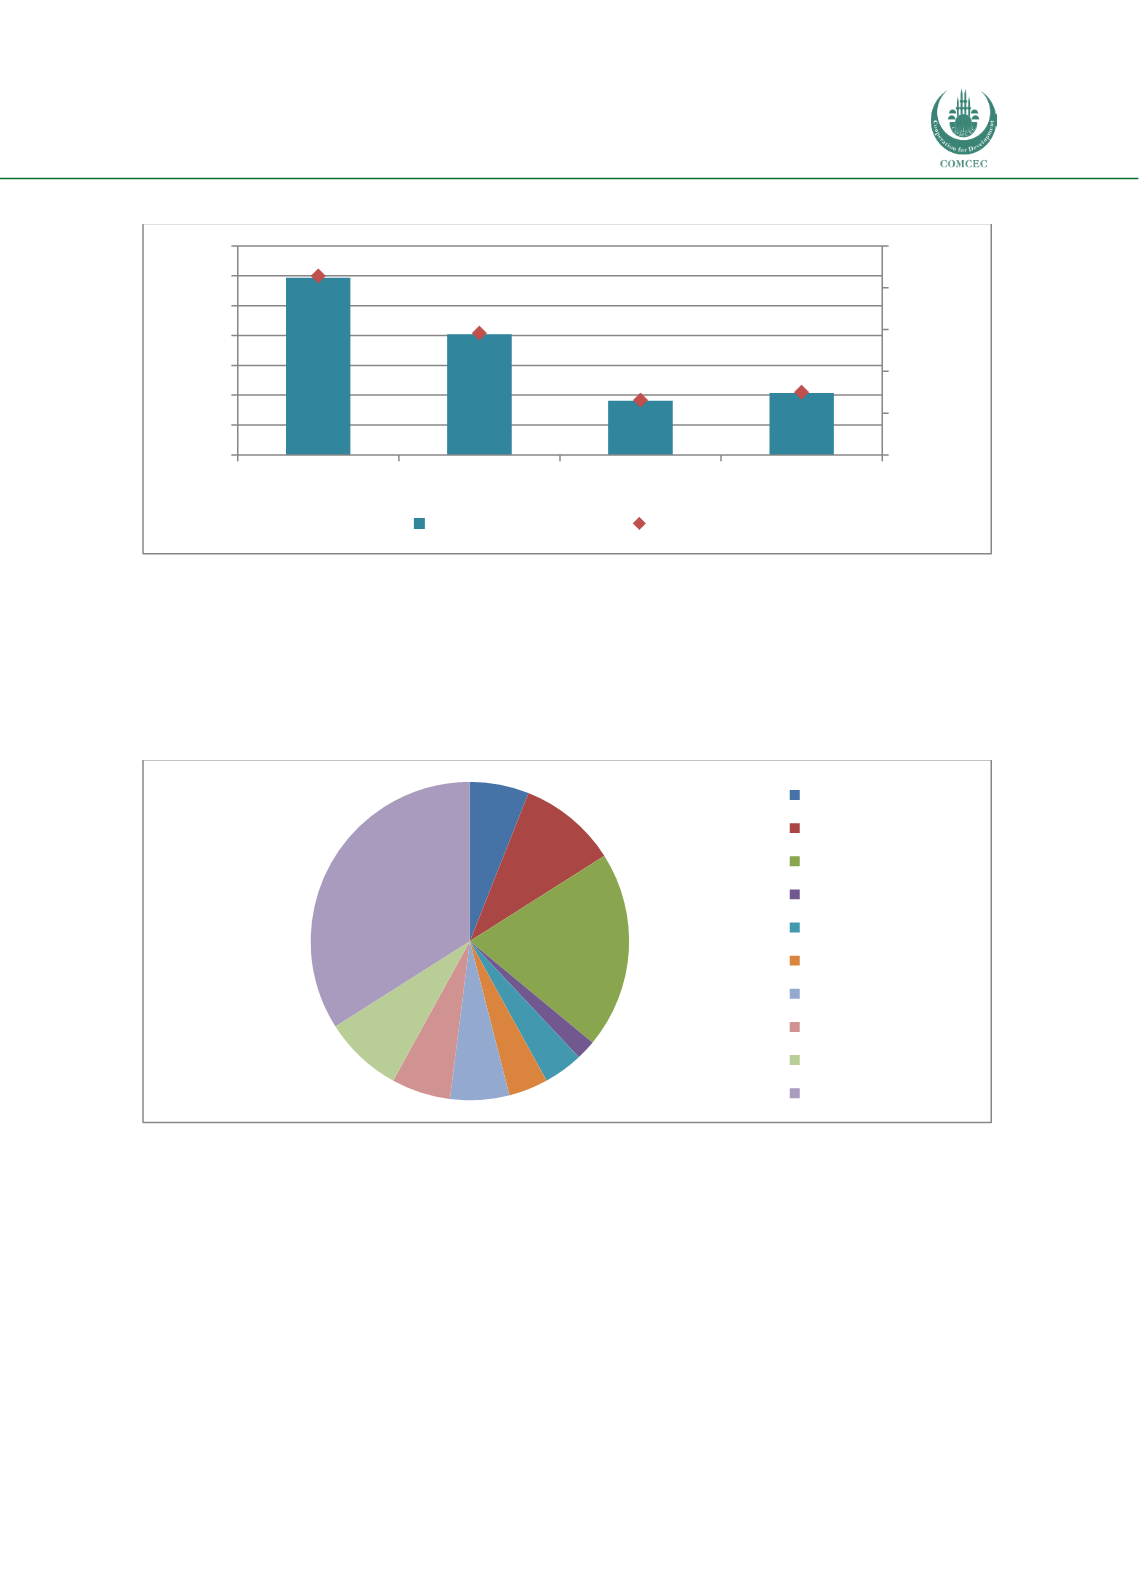
The regional distribution of the investments in economic infrastructure during 2017-35 is
shown in Chart 1.5. Close to one-third (34%) of the total USD 69.4 trillion investment for the
period is expected to be in China and one-fifth is expected to be in the United States. Many
developing regions such as Africa, the Middle East and emerging countries in Asia will have a
relatively smaller share of investments during the period.
Chart 1.5: Aggregate Spending on Economic Infrastructure by Region 2017-35
Source: McKinsey (2017: 3)
In a recent study of 50 countries representing 85% of the global GDP, the Global Infrastructure
Hub and Oxford Economics (2018) estimate that, at current trends of investment, the
cumulative global infrastructure investments would be around USD 78.8 trillion over the
period of 2016-2040. With investment needs of USD 93.7 trillion, this would imply a shortfall
of investments worth USD 14.9 trillion over the period (see Chart 1. 6).
29.7
20.2
9.1
10.4
42.8%
29.1%
13.1%
15.0%
0%
10%
20%
30%
40%
50%
0
5
10
15
20
25
30
35
Transport
Power
Water
Telecom
% of total
USD (trillion)
Spending (US$trillion)
% of total
6%
10%
20%
2%
4%
4%
6% 6%
8%
34%
Developed Asia
Western Europe
United States
Africa
Eastern Europe
Middle East
Latin America
Other Emerging Asia
India
China