


 28 / 228

Infrastructure Financing through Islamic
Finance in the Islamic Countries
12
status for OIC MCs underscores the point that there is a need to make huge investments in the
infrastructure sector to achieve growth and attain the SDGs.
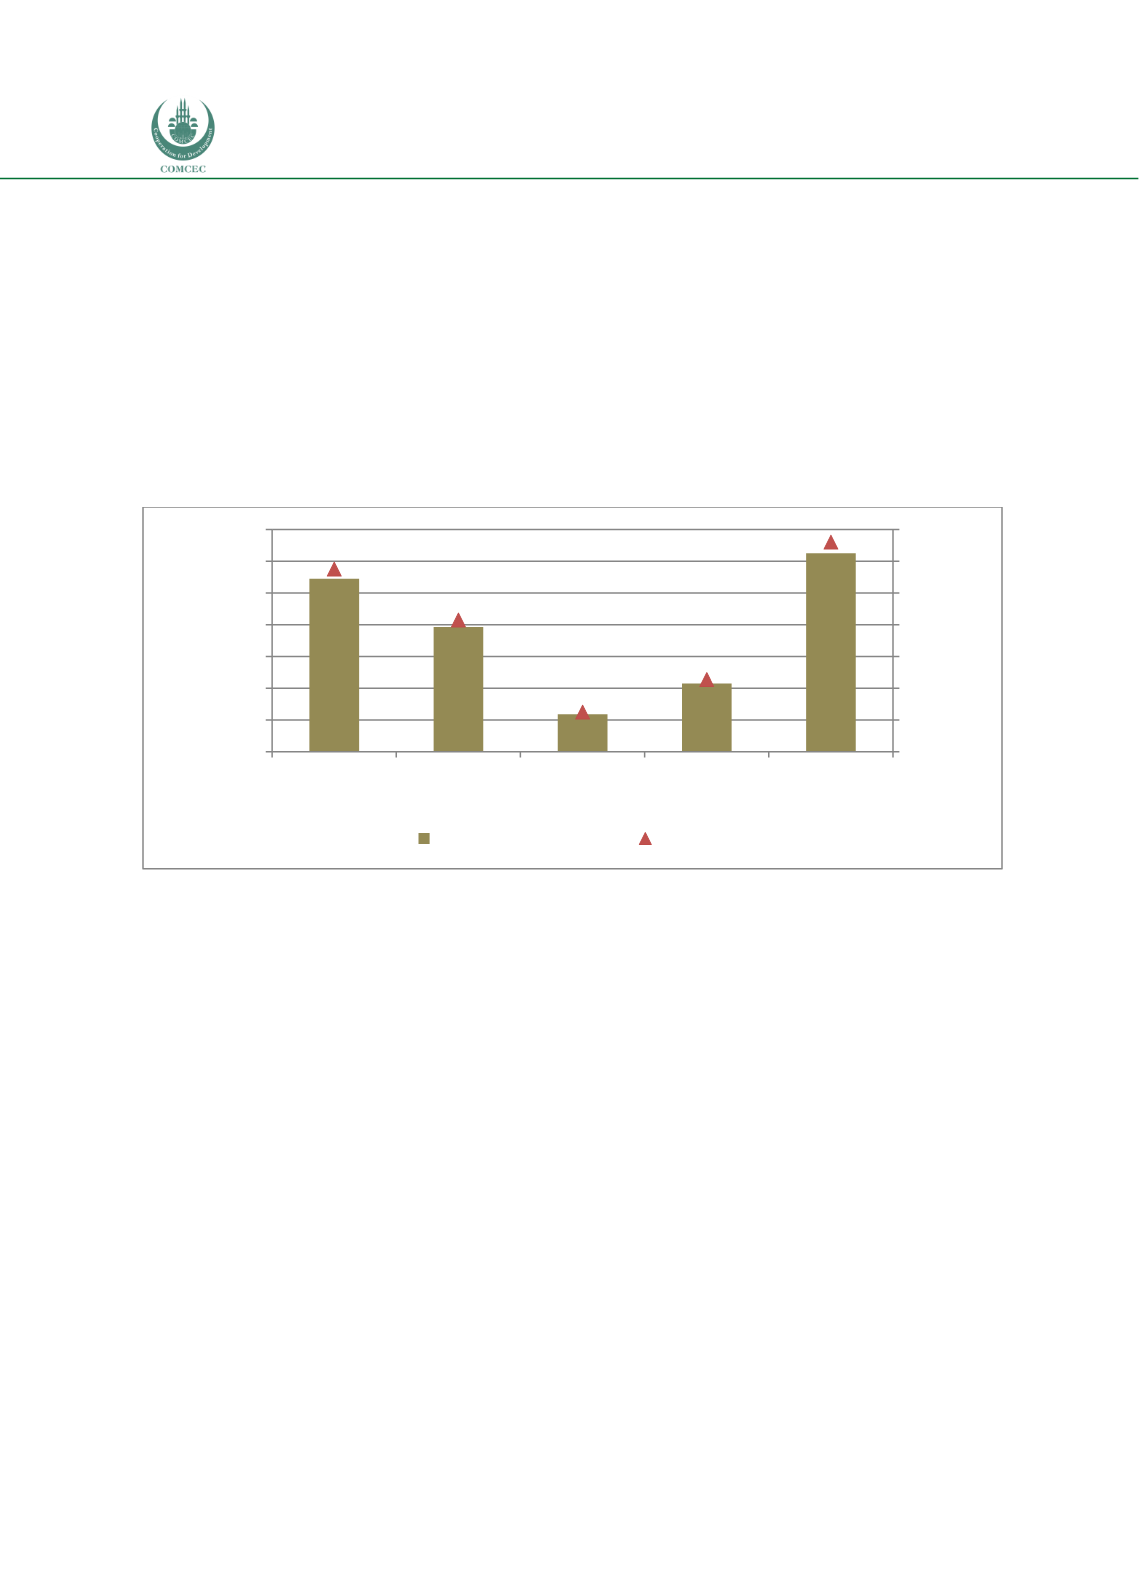
McKinsey (2017) reports that a total of USD 3.79 trillion was spent on economic and social
infrastructure globally during 2015. The breakdown of the infrastructure spending across
different sectors during the year is shown in Chart 1.3. The chart shows that while the bulk of
the funds going to the economic infrastructure accounts for USD 2.54 trillion, USD1.25 trillion
(or 33% of the total) was spent on social infrastructure. The largest expenditure in economic
infrastructure was in the transportation sector (USD 1,089 billion or 28.7% of the total)
followed by the power sector (USD 785 billion or 20.7% of the total) and telecom sector (USD
430 billion or 11.3% of the total).
Chart 1.3: Global Infrastructure Spending by Asset Class 2015 (USD billion)
Source: McKinsey (2017: 1)
Different estimates of the needs of infrastructure investments globally identify huge gaps,
particularly in relation to achieving the SDGs. The Global Commission on the Economy and
Climate estimates that a total of USD 90 trillion (or USD 6 trillion a year) would be needed
during 2015-2030 globally for investments in urban, land use and energy systems (GCEC 2014:
8 and GCEC 2016: 8). In a study done in 2016, McKinsey (2016: 10) reports that USD 93 trillion
would be needed for investments in sustainable infrastructure during 2015-2030, of which
funding in economic infrastructure would amount to USD 49.1 trillion (or USD 3.3 trillion
annually). In an updated report, McKinsey (2017) revised the estimates of global investment in
economic infrastructure for the period 2017-2035 to a total of USD 69.4 trillion, raising the
annual investment requirements to USD 3.7 trillion. The distribution of the investment needs
in different economic infrastructure sectors for 2017-2035 is shown in Chart 1.4. The chart
shows that most of the investments in the economic infrastructure during the period would go
to the transport sector (USD 29.7 trillion or 42.8% of the total) followed by the power sector
(USD 20.2 trillion or 29.1% of the total). The report further indicates that the annual spending
is likely to increase by an additional USD 1 trillion per year to meet the SDGs.
1,089
785
236
430
1,250
28.7%
20.7%
6.2%
11.3%
33.0%
0%
5%
10%
15%
20%
25%
30%
35%
-
200
400
600
800
1,000
1,200
1,400
Transport
Power
Water
Telecom Social
infrastructure
% of total
USD (billion)
Spending (US$ billion)
% of total