


 114 / 187

Islamic Fund Management
100
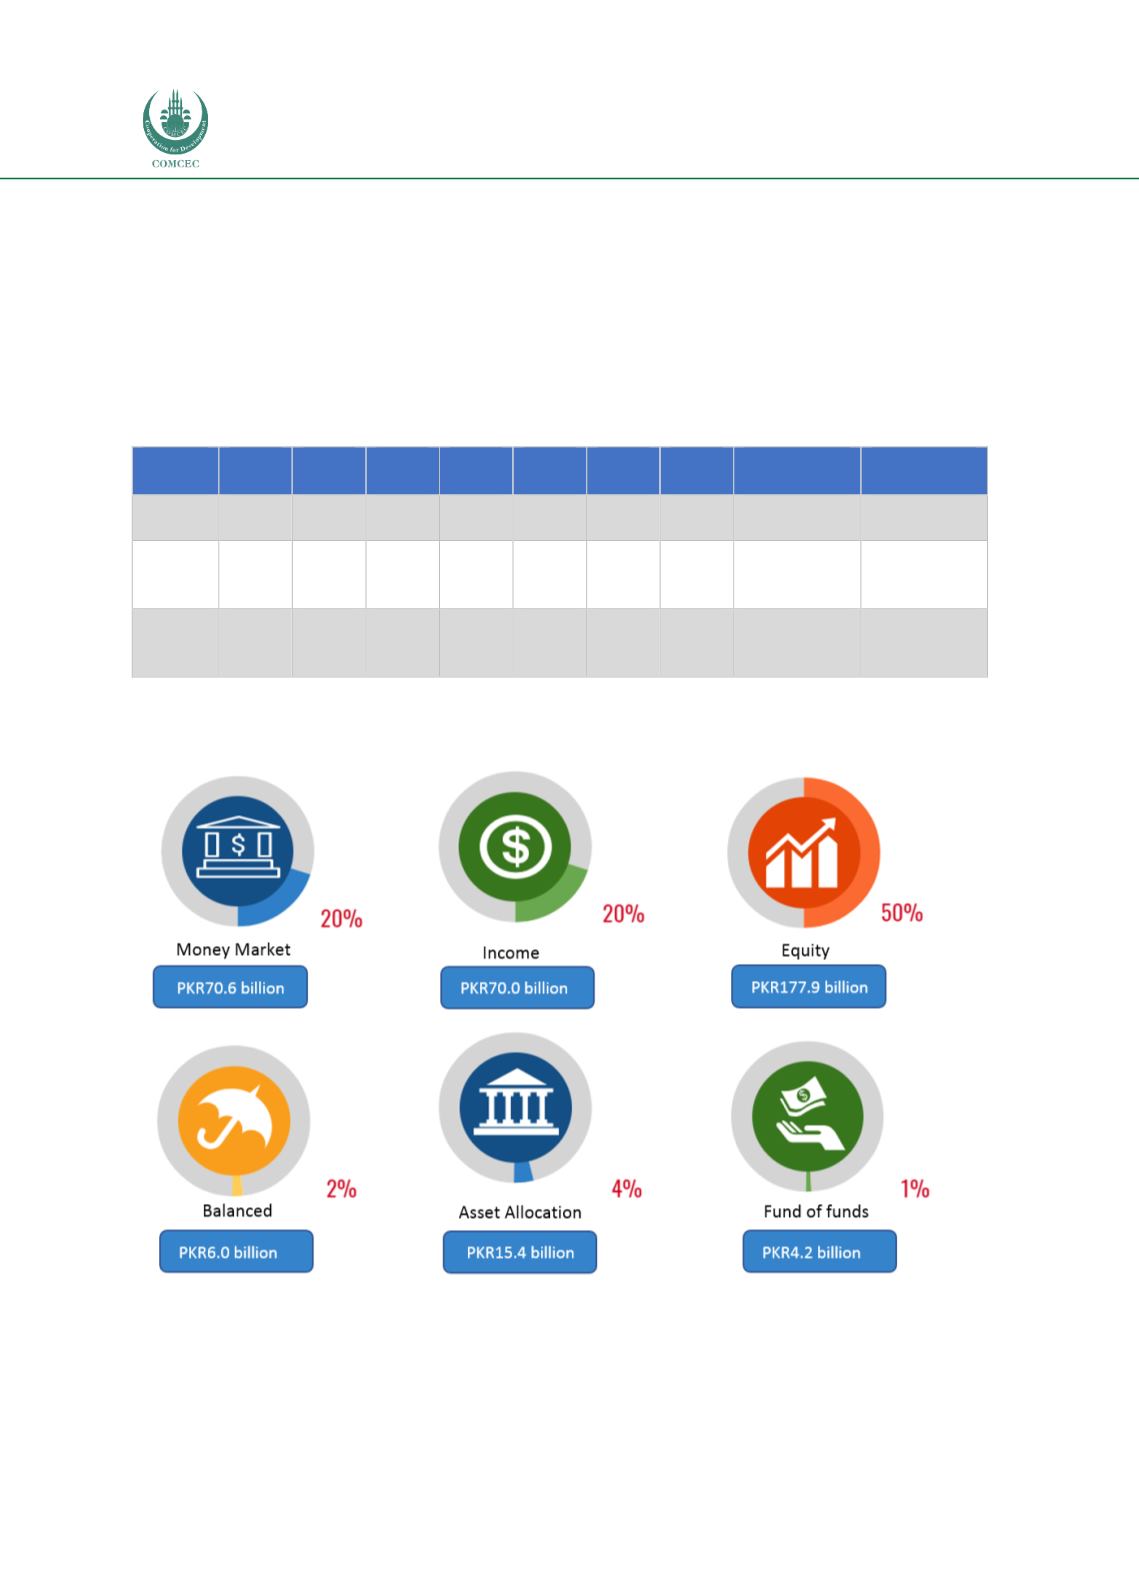
The AuM for Pakistan’s mutual funds features a diversified portfolio comprising various asset
classes. Equity funds have been commanding the lion’s share in terms of both conventional and
Islamic funds, as illustrated in
Chart 4.11and
Chart 4.12 ,respectively. This is partly due to
the strong performance of the KSE Meezan Index (KMI-30), i.e. the benchmark Shariah equity
index for Islamic investment, and the KSE-100 Index for the conventional space. In fact, the
KMI-30 Index has significantly outperformed the other indices over the years. In addition, this
index has generated a cumulative return of over 170% in the last few years―more than any
other index, as illustrated i
n Table 4.10 .Table 4.10: Historical Returns of Indices in Pakistan (USD-Based Returns (%))
FY12
FY13
FY14
FY15
FY16
FY17
FY18
(Apr)
Cumulative
Returns
Annualised
Returns
KMI-30
Index
3.0
47.1
30.0
16.4
12.0
18.4
-11.2
170.2
15.6
KSE-30
- Total
Return*
N/A
N/A
17.5
8.8
3.9
17.5
-12.0
37.3
7.6
KSE-
100
Index
0.2
45.0
41.3
12.4
6.5
22.9
-11.5
167.3
15.5
Source: Al Meezan (2018)
* The KSE-30-Total Return index was launched on 1 January 2014.
Chart 4.11: Conventional Mutual Funds – Net Assets Based on Asset Class (2013-2017)
Source: MUFAP (2017)
Note: The balance of PKR5.61 billion is classified as ‘others’, which include capital protected, fund of funds (CPPI),
aggressive fixed income, index tracker, commodities.