


 29 / 64

COMCEC Poverty Outlook 2016:
Human Development in OIC
21
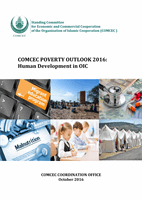
Figure 20: Trends in Human Development Index, 1990-2015
Source: Own calculations from UNDP (2015).
Note: The averages are unweighted. That is, each country in the groups has the same weight irrespective of its
population.
The annual growth rate in HDI values between 1990 and 2015 are given in
Figure 21.Not
surprisingly, the annual growth rate is higher for the groups with lower initial HDI values.
During the period, OIC member states exhibit almost 0.8 percent growth per year. This rate is
higher than that of OECD and world but lower than developing countries and LDCs. The
difference between growth rates of OIC member states and developing countries also explains
the widening gap between the HDI values of these country groups. Given the current growth
rate, it will take approximately another 18 years
22
for the OIC to reach the current level of
world average.
22 Own calculations.
0,505
0,544
0,603
0,616
0,785
0,834
0,872
0,880
0,513
0,568
0,642
0,660
0,348
0,399
0,484
0,502
0,597
0,641
0,697
0,711
0,200
0,400
0,600
0,800
1,000
1990
2000
2010
2015
OIC
OECD Developing countries
LDC's
World