


 27 / 64

COMCEC Poverty Outlook 2016:
Human Development in OIC
19
schooling, the index values of this group vary between 1.4 (Burkina Faso) and 5.4 (Uganda),
and only two countries (Togo and Uganda) have index values above the LHD average value
which is 4.5 Index values for the fourth dimension, expected years of schooling, is the best
among the HDI dimensions, since almost half of the low income countries have an index value
which is above the LHD average index value (9) ranging between 5.4 (Niger) and 11.5
(Comoros).
Multidimensional Poverty Index
MPI values for the low income OIC Member Countries are between 0.165 (Comoros) and 0.584
(Niger).
21
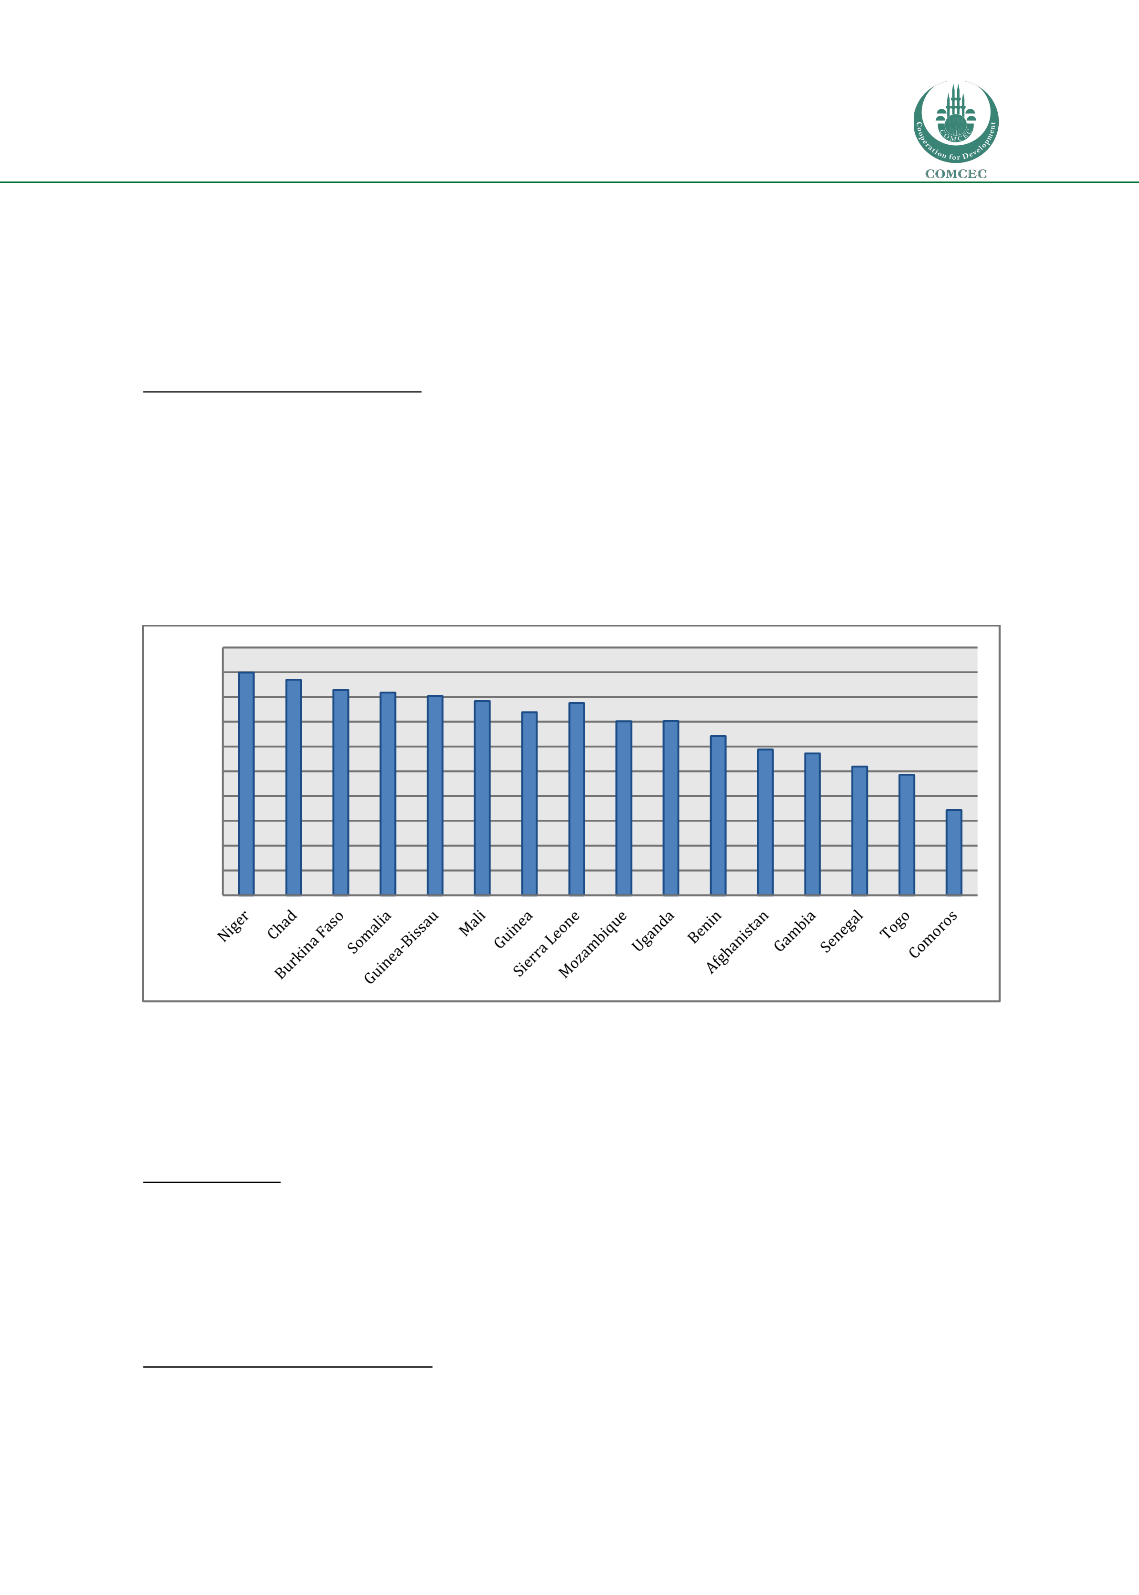
For all the countries Except Comoros and Togo in this income group, the rates of the
population in multidimensional poverty are higher than 50 percent
(Figure 19). The highest
share belongs to Niger with almost 90 percent. The share of population in severe
multidimensional poverty ranges between 14.9 percent (Comors) and 73.5 percent (Niger),
and 38 percent of the low income OIC countries more than half of the population are in severe
poverty.
Figure 19: Multidimensional Poverty Rate in Low Income OIC Member Countries
Source: UNDP, 2015.
The contribution of deprivation in education to overall multidimensional poverty ranges
between 19 (Uganda) and 45.6 (Afghanistan), the contribution of deprivation in health ranges
between 18.8 (Somalia) and 30.9 (the Gambia), and the contribution of deprivation in living
conditions ranges between 35.2 (Afghanistan) and 51.9 (Uganda).
State of Hunger
All the countries in the low income group are in the position of “low income food-deficit
country”. The GHI values of these countries range from 21.5 (Gambia) to 46.4 (Chad). More
than half of these countries have serious hunger situation, one-third have an alarming
situation, and index values for two countries are not available
(Table 4).
21
See Annex 8.
89,8 86,9
82,8 81,8 80,4 78,4
73,8
77,5
70,2 70,3
64,2
58,8 57,2
51,9
48,5
34,3
0,0
10,0
20,0
30,0
40,0
50,0
60,0
70,0
80,0
90,0
100,0