


 42 / 113

COMCEC Trade Outlook 2017
36
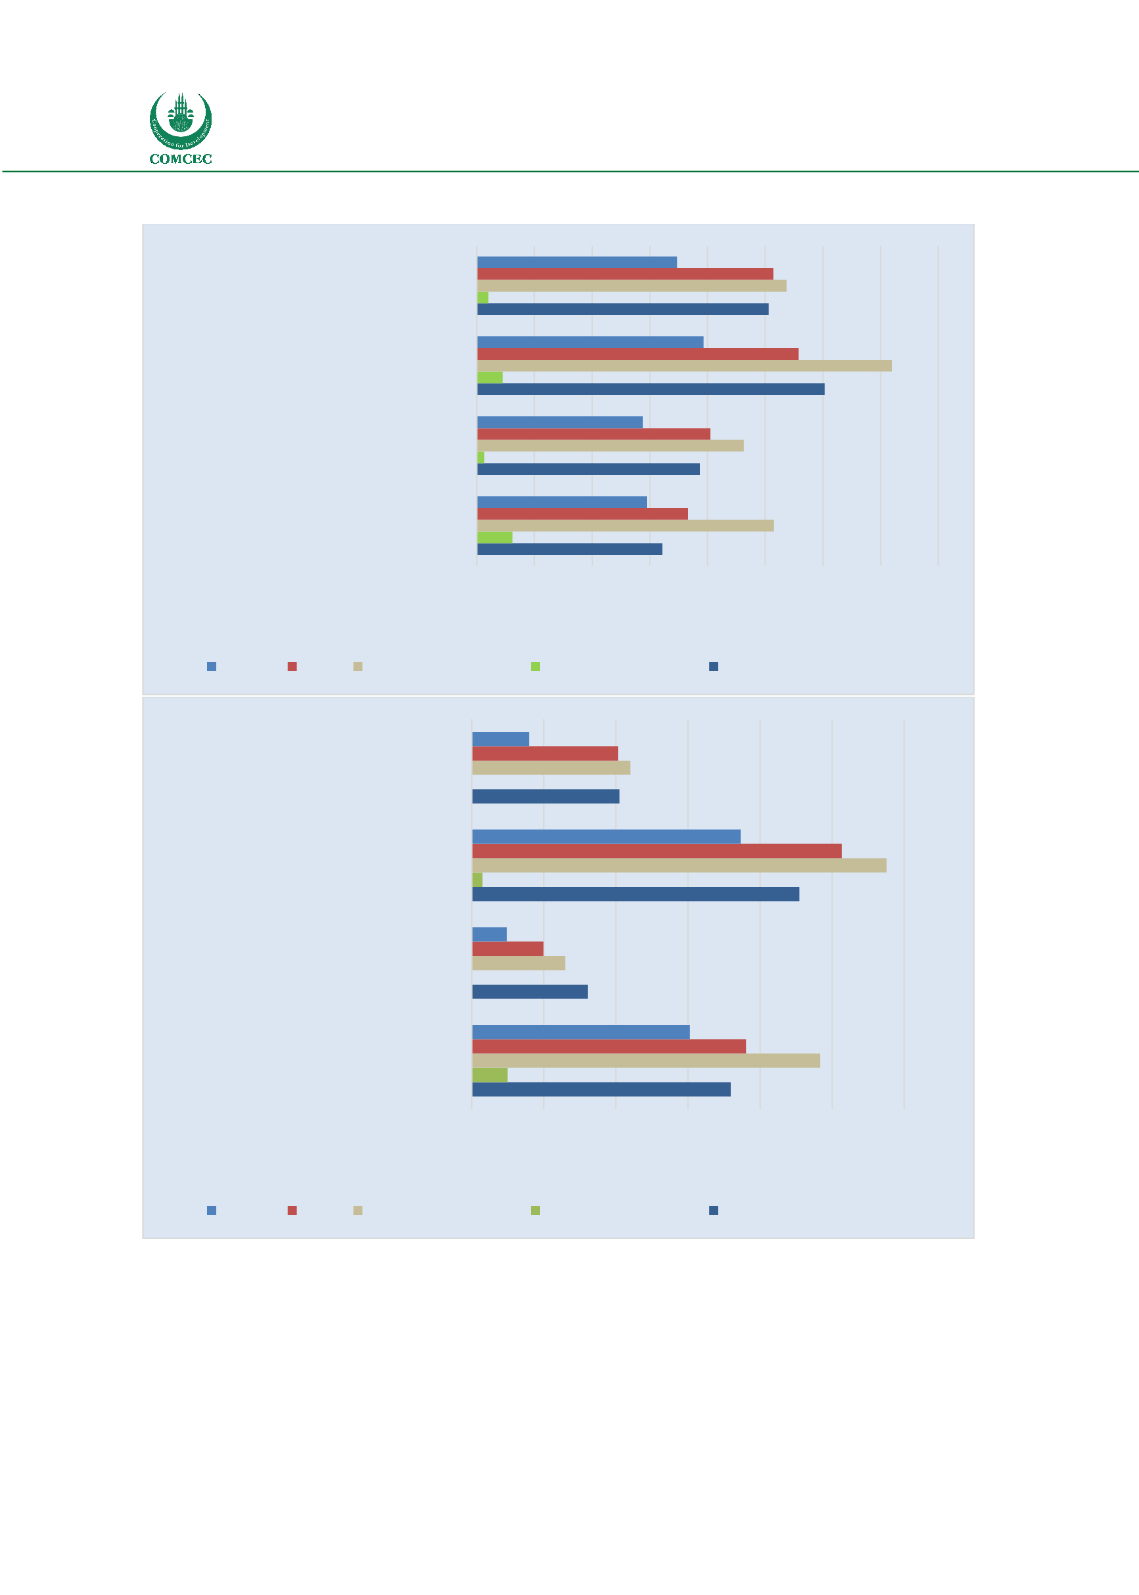
Figure 42: Time and Cost for Complying Documentary and Border Compliance
Source: WB Doing Business data
Figure 43 depicts the rankings of OIC countries based on the distance to frontier scores in WB
Doing Business 2017. Out of the 190 countries covered by theWB Doing Business although there
are a few OIC countries such as Albania (rank 24), Jordan (rank 50), and Malaysia (rank 60)
which ranked relatively better, many OIC countries are ranked at the last places.
64.4
77.4
120.6
101.2
12.4
2.6
9.0
4.0
103
92.6
143.9
107.4
73.2
81.0
111.6
102.8
59.0
57.6
78.6
69.4
0 20 40 60 80 100 120 140 160
Time to export: Border compliance
Time to export: Documentary compliance
Time to import: Border compliance
Time to import: Documentary compliance
(hours)
World OIC Sub-Saharan Africa OECD high income Middle East&North Africa
459.6
261.3
554.5
305.1
149.9
115.1
583.4
229.6
675.9
320.1
480.6
199.8
613.7
303.0
402.8
148.7
473.4
179.6
100 200 300 400 500 600 700
Cost to export: Border compliance
Cost to export: Documentary compliance
Cost to import: Border compliance
Cost to import: Documentary compliance
(USD)
World OIC Sub-Saharan Africa OECD high income Middle East&North Africa