


 44 / 113

COMCEC Trade Outlook 2017
38
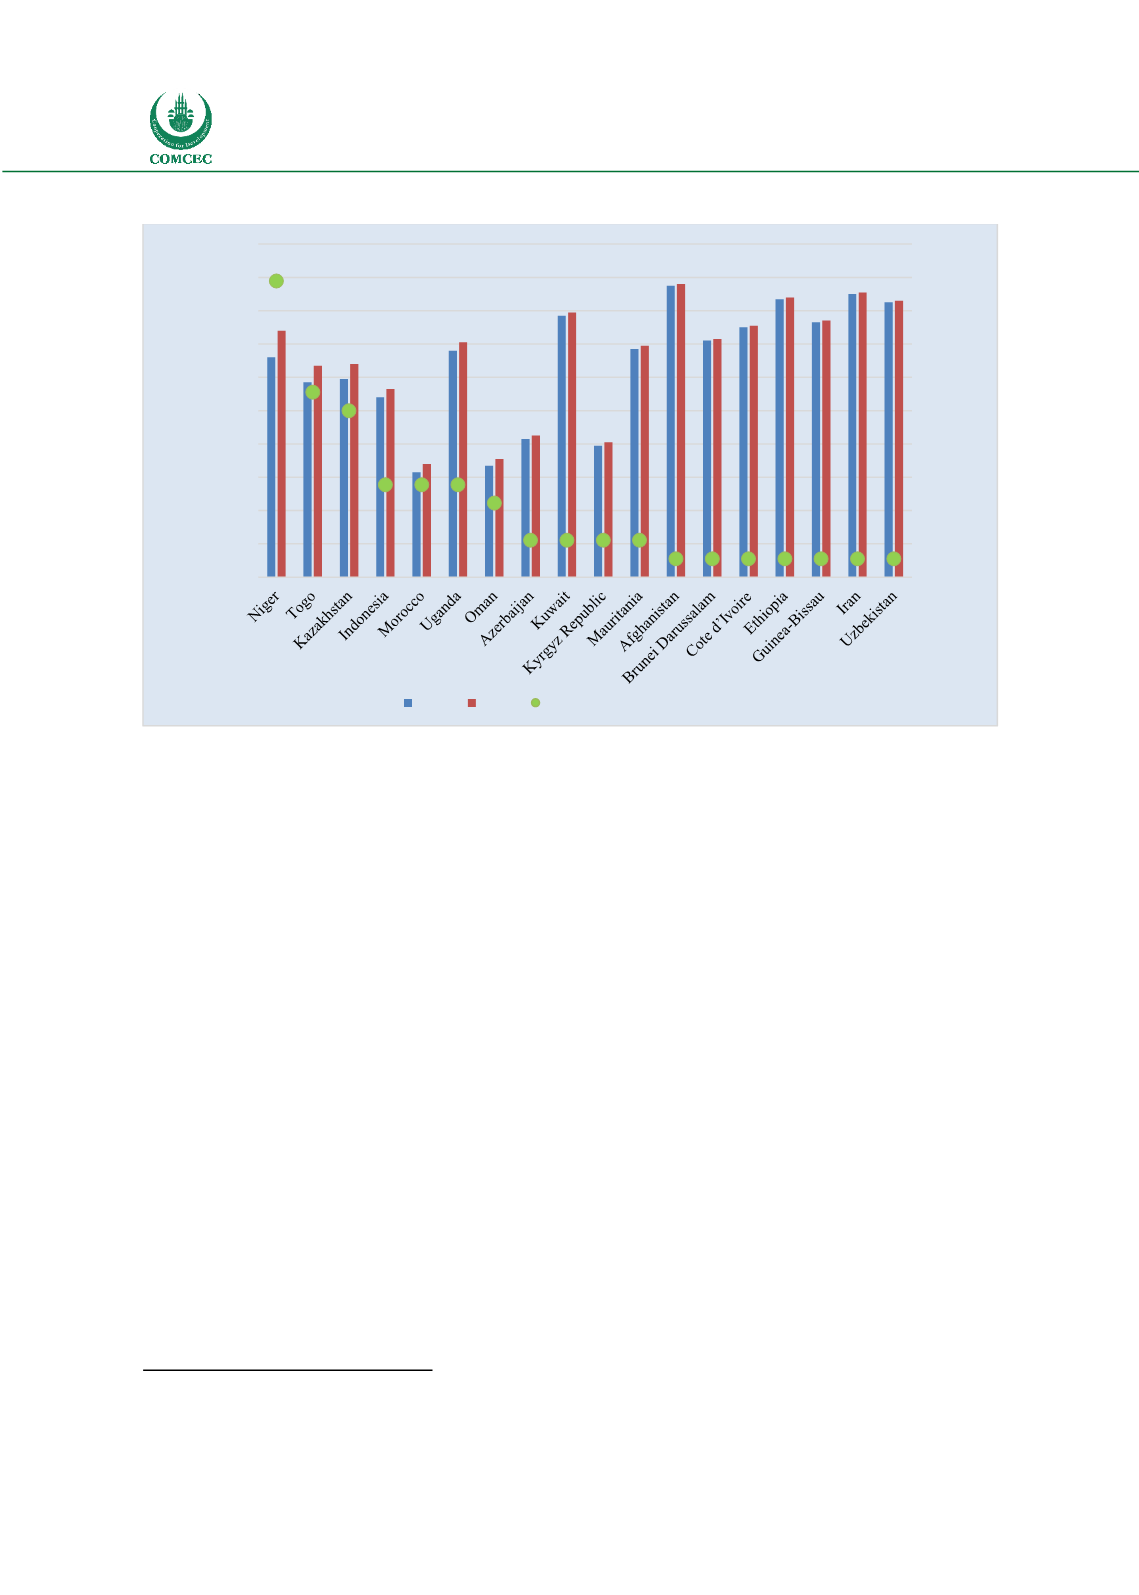
Figure 44: OIC Countries that Improved the Most at Trading Across Borders
Source: World Bank Doing Business data
Figures 45 and 46 illustrate border and documentary compliance costs and times for the lowest
and highest ranked OIC member states according to the distance to frontier scores for trading
across borders
16
. The figures reveals that the cost and times for trade substantially vary among
the OIC Member States. For instance, while in Albania, ranking first in trading across borders
amongst the OIC, the cost of border compliance in exporting is 55 dollars, it goes up to 1633
dollars in Gabon. On the other hand, in terms of border compliance times in exporting, it takes 9
hours for border compliance in Albania while it takes 202 hours in Cameroon. Reducing trade
costs in the OIC member states is important to gain access and to be more competitive in the
international markets.
16
The distance to frontier score shows how far on average an economy is from the best performance achieved by any
economy on WB-Trading Across Borders indicator.
0
2
4
6
8
10
12
14
16
18
0
20
40
60
80
100
120
140
160
180
200
Change in Rank
Trading Across Borders rank
2017 2016 change in the rank (2017-2016)