


 31 / 96

Activation Policies for the Poor in OIC Member States
23
2.
Overview of Activation in the OIC Member States
This section presents an overview of the activation policies and programmes in place in OIC Member
States. This section will cover:
Employment situation in OIC Member States
Activation policies and programmes implemented
Both of these areas will be discussed according to OIC Member States’ income groupings, in
recognition of the varying degrees of economic development that OIC Member States are in. Details
of the Member States in each income grouping can be found in Annex 1.
As explained in the Scope, the design of activation measures varies according to countries’
economies and labour market conditions. Before considering the employment situation and
activation measures implemented in OIC Member States, it is therefore useful to understand the
Member States’ demographic and economic contexts.
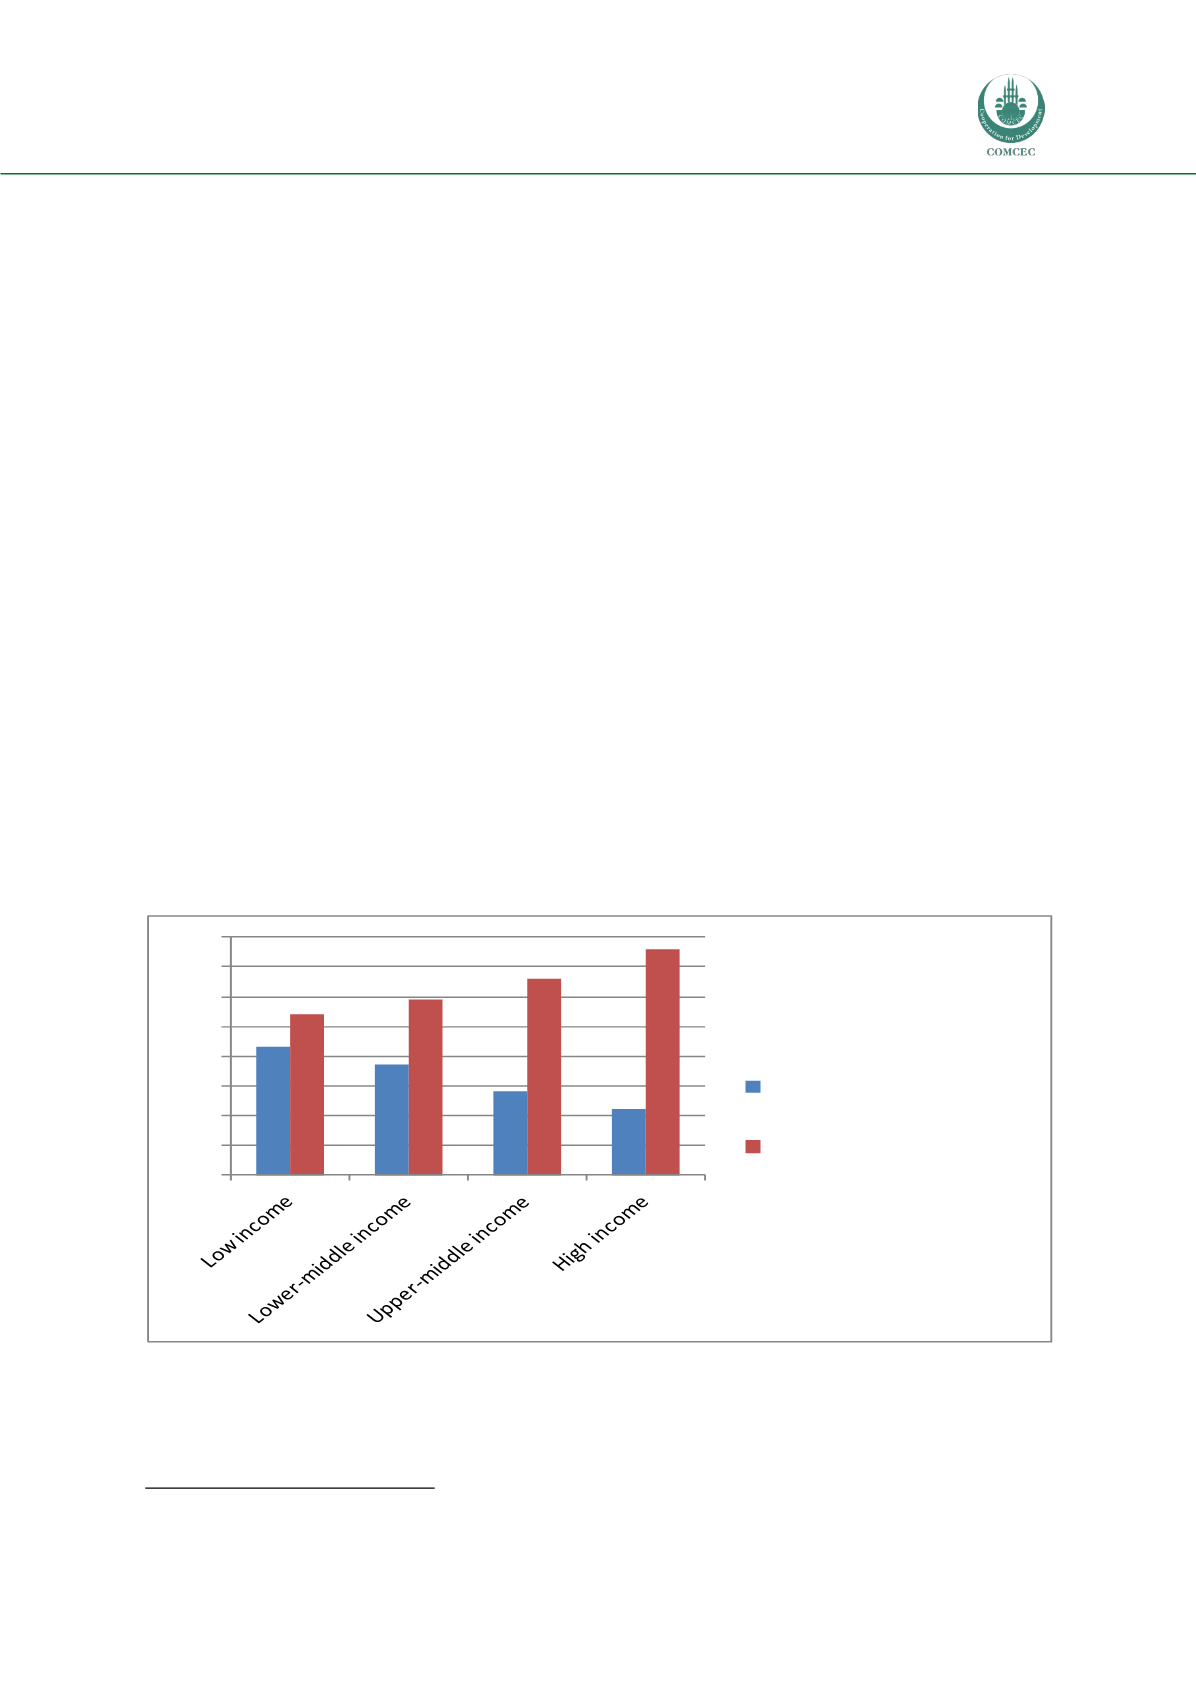
OIC Member States (particularly the low income countries) have young populations, as seen in
Figure 1. Despite this shared characteristic, there is a significant difference between the size of high
income and low income OIC Member States’ young populations. Low income Member States tend to
have the youngest populations, whereas high income Member States have the largest working age
populations. This contrasts strongly with other countries outside the OIC, such as in Western
Europe, where countries tend to have older populations. In the United Kingdom, for example, only
17.3% of the total population is aged 0-14, less than half the average size of this age group for low
income OIC Member States.
9
Because of OIC Member States’ young populations, they must ensure
job creation keeps pace with the growing labour force. Several Member States’ employment and
growth strategies specifically address this and this is why several activation measures presented in
this section specifically target the young.
Figure 1: Demography of the OIC Member States, 2013
Source: SESRIC, OIC
Although low income Member States tend to have the youngest populations, there are significant
differences between countries. Niger, Chad and Uganda have the youngest populations, with
between 48% and 50% of the populations aged under 15. In Bangladesh and the Kyrgyz Republic, on
9
Index Mundi, United Kingdom Demographics Profile 2014
0%
10%
20%
30%
40%
50%
60%
70%
80%
Population aged 0-14, %
of total
Population aged 15-64, %
of total