


 29 / 63

COMCEC Poverty Outlook 2017
21
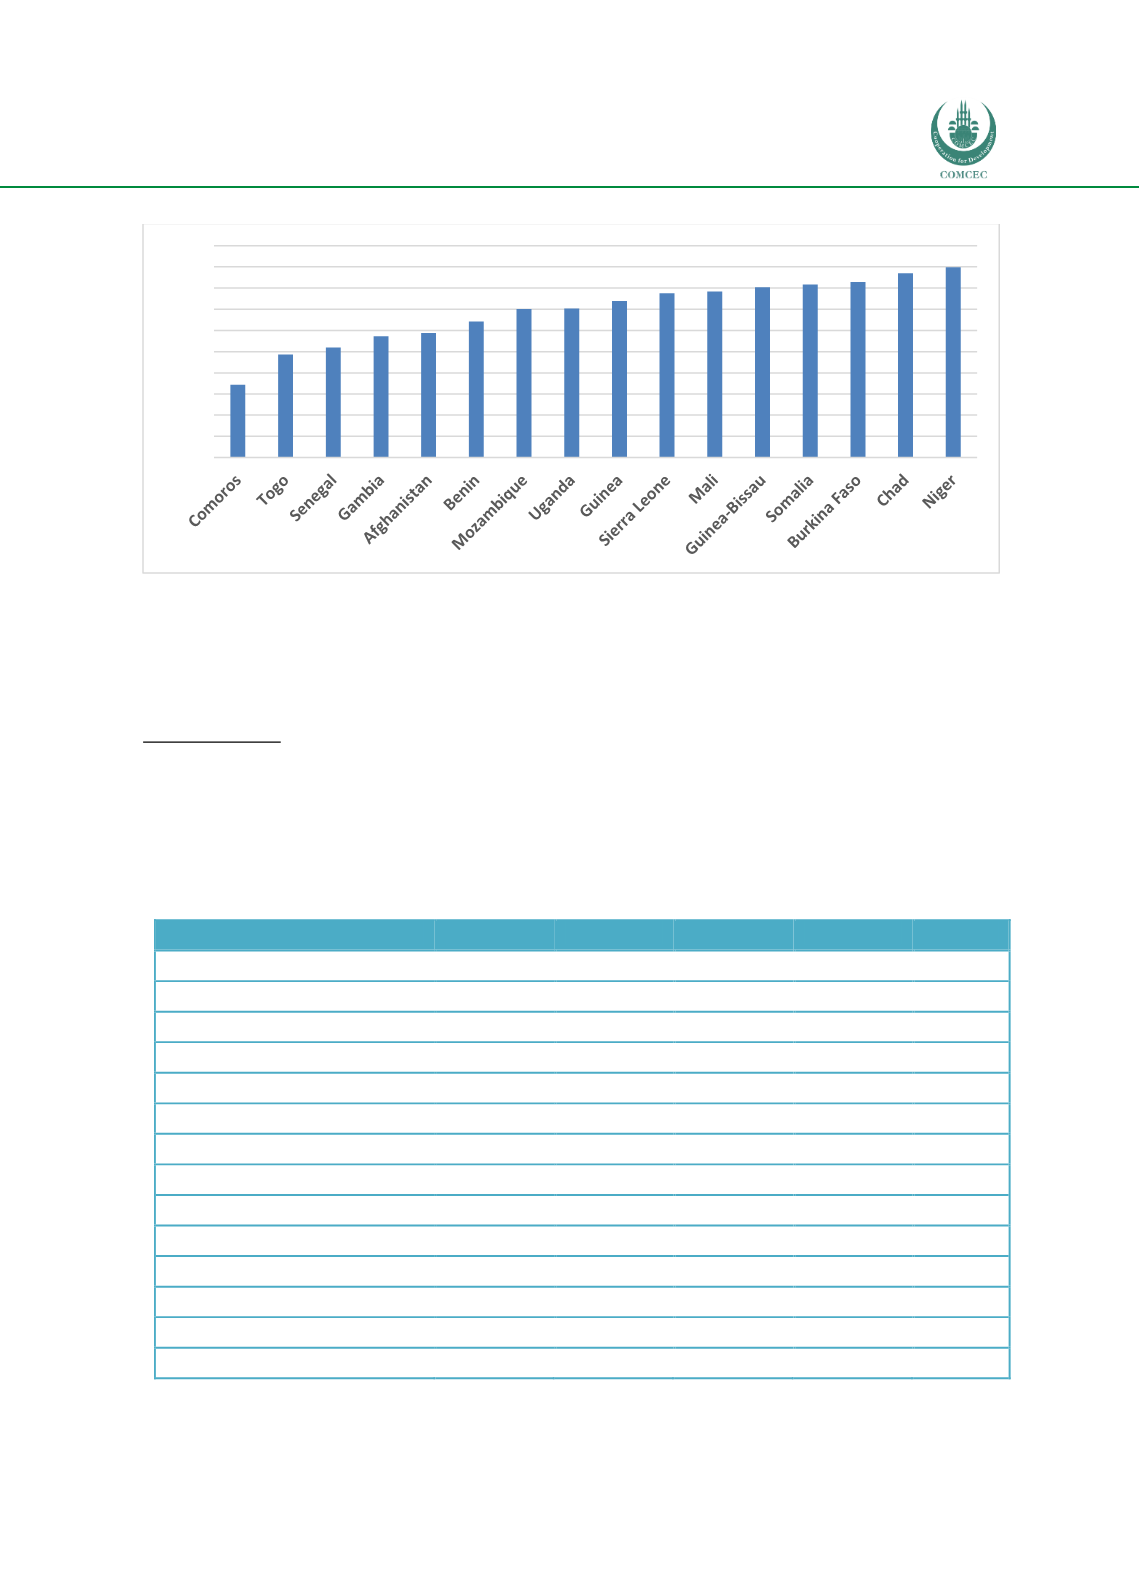
Figure 19: Multidimensional Poverty Rate in Low Income OIC Member Countries
Source: UNDP, 2016.
The contribution of deprivation in education to overall multidimensional poverty ranges
between 18 (Uganda) and 45.6 (Afghanistan), the contribution of deprivation in health ranges
between 18.8 (Somalia) and 30.9 (the Gambia), and the contribution of deprivation in living
conditions ranges between 33.4 (Senegal) and 51.9 (Uganda).
State of Hunger
All the countries in the low income group are in the position of “low income food-deficit
country”. The GHI values of these countries ranged from 16.5 (Senegal) to 44.3 (Chad) in 2016.
11 out of 16 of these countries have serious hunger situation, 2 countries have an alarming
situation, 1 country has moderate hunger situation and index values for two countries are not
available
(Table 4).
Table 4: Global Hunger Index Values of Low Income OIC Member Countries
Country
1990
1995
2000
2005
2016
Afghanistan
47,4
55,9
52,5
44,9
34,8
Benin
46,1
42,6
38,2
33,3
23,2
Burkina Faso
53,0
46,1
48,4
49,6
31
Chad
65,0
60,6
52,0
53,1
44,3
Gambia
36,4
35,4
27,9
26,3
20,9
Guinea
47,8
45,8
44,4
38,0
28,1
Guinea-Bissau
-
45,2
43,9
31,9
27,4
Mali
51,9
51,3
43,9
38,3
28,1
Mozambique
64,5
63,2
49,2
42,4
31,7
Niger
64,7
62,7
53,0
42,8
33,7
Senegal
36,8
36,9
37,9
28,5
16,5
Sierra Leone
58,8
56,0
53,5
52,4
35
Togo
42,5
44,1
38,6
36,4
22,4
Uganda
39,8
40,9
39,3
32,2
26,4
Source: IFPRI
et.al., 2015.
Note: Index values for Comoros and Somalia are not calculated.
34,3
48,5 51,9
57,2 58,8
64,2
70,2 70,3 73,8 77,5 78,4 80,4 81,8 82,8 86,9 89,8
0,0
10,0
20,0
30,0
40,0
50,0
60,0
70,0
80,0
90,0
100,0