
COMCEC Poverty Outlook 2017
18
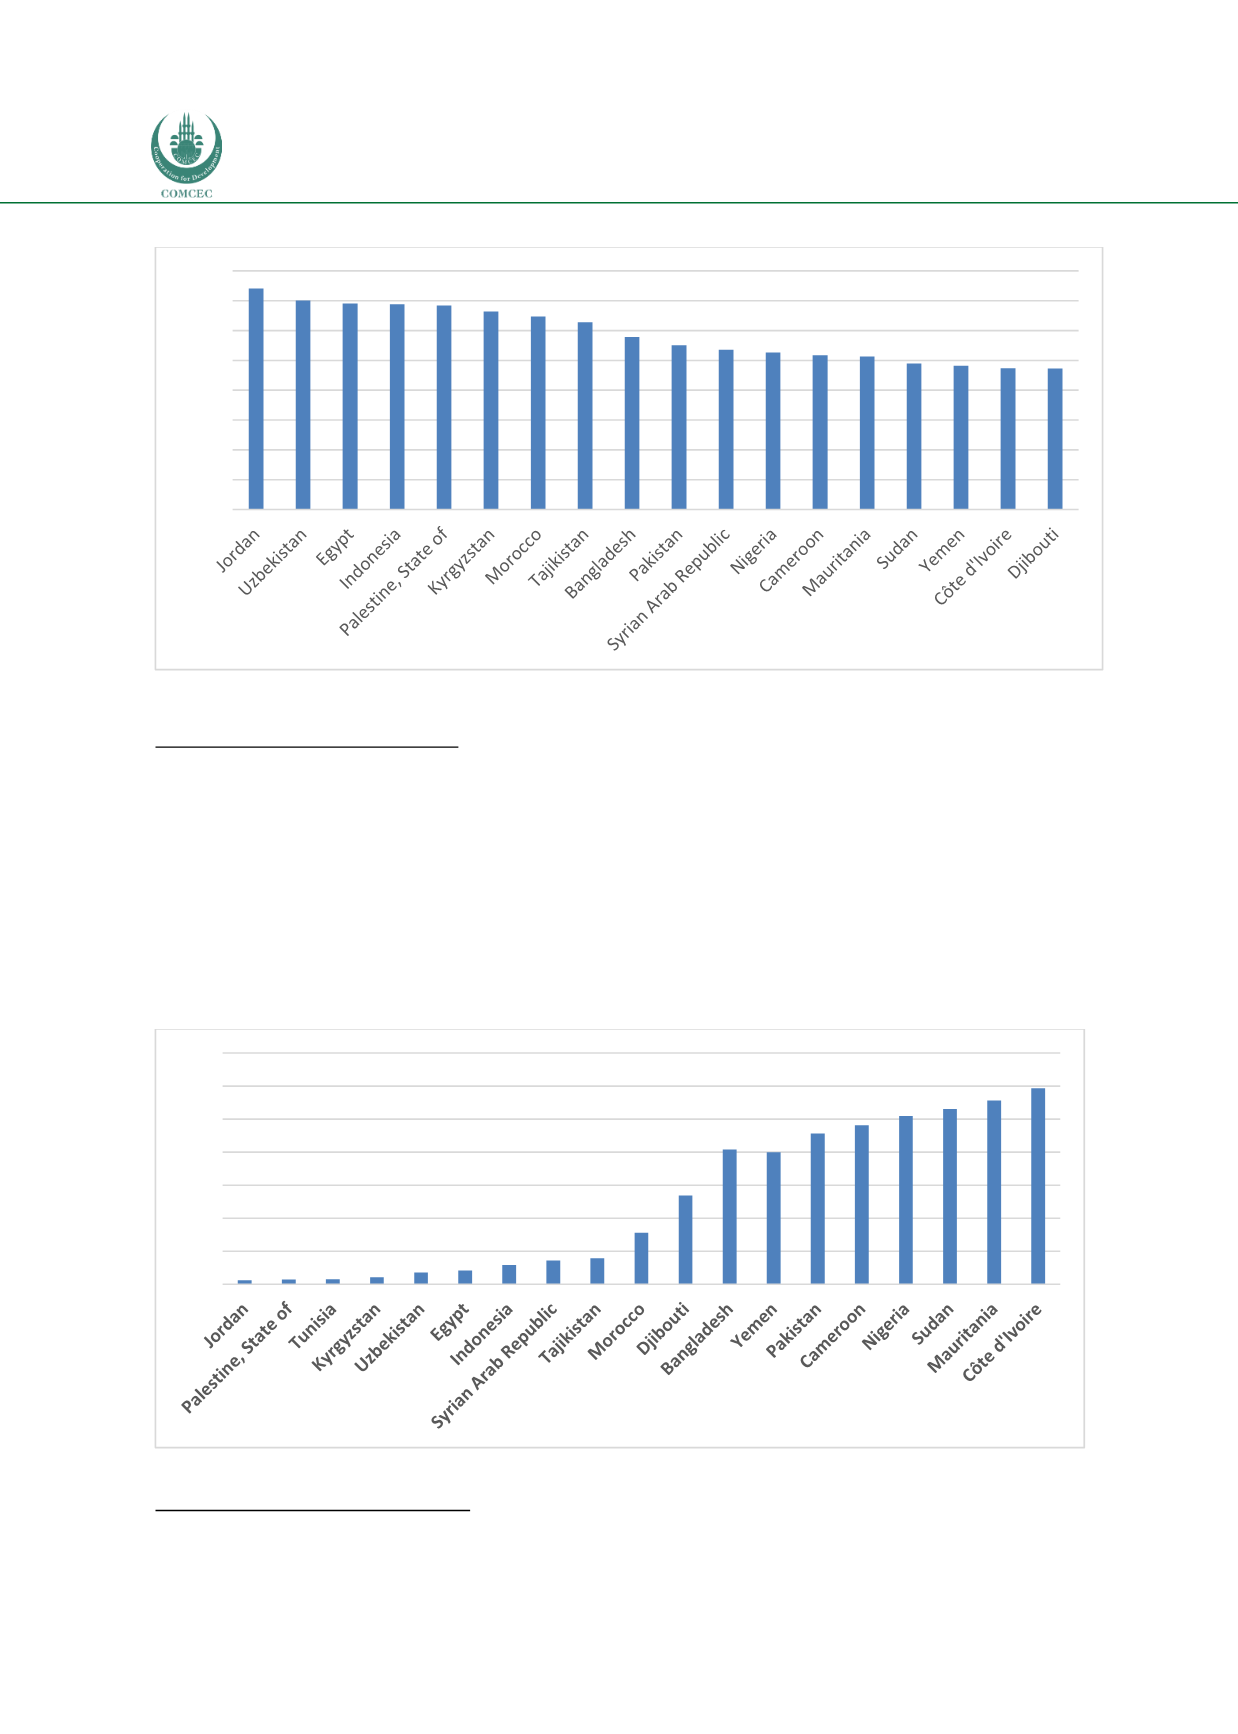
Figure 16: HDI Values of Lower-Middle Income OIC Member Countries
Source: The UNDP, 2016.
Multidimensional Poverty Index
MPI values for the lower-middle income OIC Member Countries are in the range of 0.004
(Jordan) – 0.307 (Cote d’Ivore).
19
In the lower-middle income group, half of these countries have
an MPI value that is two-times or more higher than the highest MPI value in the upper-middle
income group. Indeed, the MPI values of more than half of the lower-middle income countries
are above 0.073 which is the highest MPI value of the upper-middle income group
(Figure 17).
In this group, the share of population live in multidimensional poverty ranges between 1.2
percent (Jordan) and 59,3 percent (Cote d’Ivore). In almost half of the lower-middle income
countries, more than 40 percent of the population is multi-dimensionally poor.
Figure 17: Multidimensional Poverty in Lower-Middle Income OIC Member Countries (%)
Source: The UNDP (2016).
19
See Annex 8.
0,741
0,701 0,691 0,689 0,684 0,664 0,647 0,627
0,579
0,550 0,536 0,527 0,518 0,513 0,490 0,482 0,474 0,473
0,000
0,100
0,200
0,300
0,400
0,500
0,600
0,700
0,800
1,2 1,4 1,5 2,2 3,5 4,2 5,9 7,2 7,9
15,6
26,9
40,7 40,0
45,6 48,2 50,9 53,1 55,6
59,3
0,0
10,0
20,0
30,0
40,0
50,0
60,0
70,0


