


 13 / 63

COMCEC Poverty Outlook 2017
5
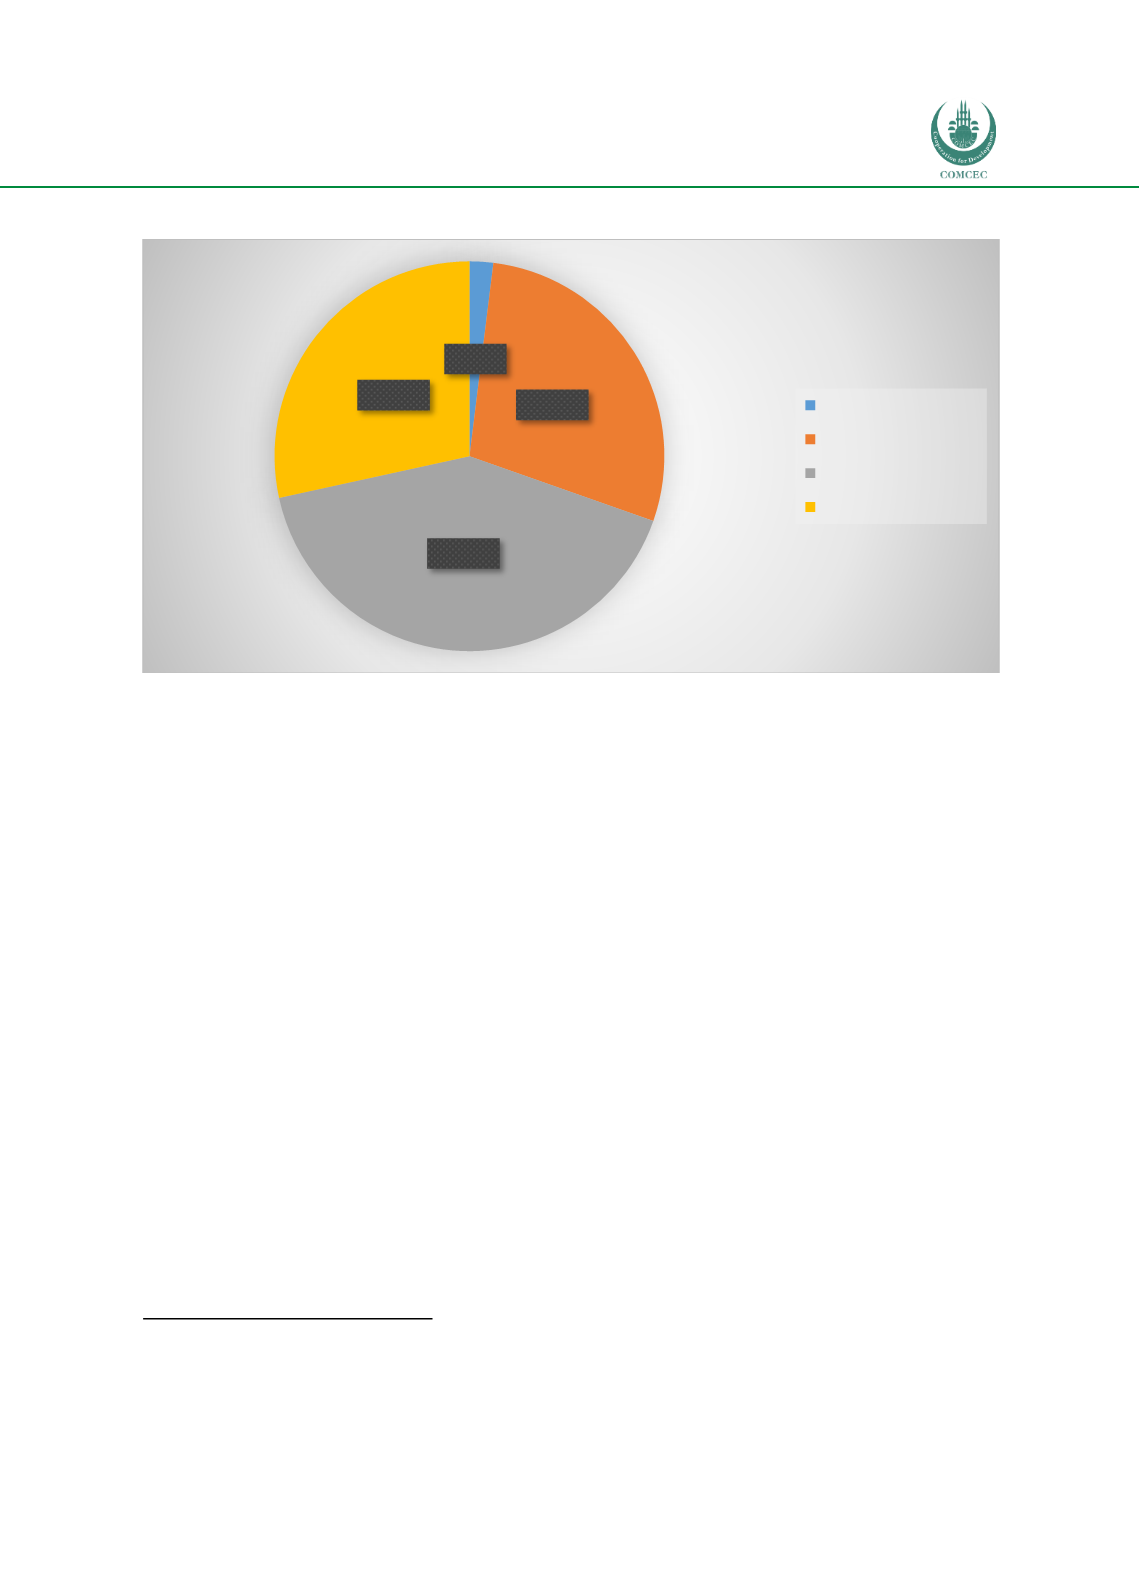
Figure 3: Share of Income Level Categories for Countries with Multidimensional Poverty (%)
Source: Own calculations from
UNDP (2016).
The percentages of the deprived population vary significantly within the same income group
countries. Looking at the contribution of deprivation in education (namely years of schooling
and child school attendance) to overall poverty, it ranges between 1.5 and 2.2 percent for high
income countries, 2.6 and 50.1 percent for upper-middle income countries, 3.4 and 54.7 percent
for lower-middle income countries and 10.8 and 45.6 for low income countries. The range for
health is much wider. It changes between 86.1 and 95.9 percent for high income countries,
between 24.7 and 89.70 percent for upper-middle income countries, 12.6 and 87.8 percent for
lower-middle income countries and 14.3 and 34.5 percent for low income countries. Likewise,
the contribution of deprivation in living standards indicator ranges from 2.6 to 11.7 percent for
high income countries, from 7.7 to 50.8 percent for upper-middle income, from 3.5 to 56.6
percent in lower-middle income and from 33.9 to 54.9 percent in low income group. The
difference between the deprivation levels of the MPI indicators among different income group
countries is striking.
8
State of Hunger
According to FAO, there are 52 low-income food-deficit countries in total, of which 37 are in
Africa, 11 are in Asia, 2 are in America and 2 are in Oceania.
9
To understand the hunger situation
of the countries, it is helpful to look at the GHI values. In this regard, according to the GHI trend
between 2000 and 2016, severity of hunger is found to be decreasing globally. Indeed, while the
value of the 2000 GHI for the developing world was 30.0, this value is 21.3 for 2016, which
8
Own calculations from UNDP(2016).
9
FAO, 2016. Low-income food-deficit countries are the countries with a net income per person that falls below
the level used by the World Bank to determine eligibility for IDA assistance and net importers of food. For full
list of low-income-food-deficit countries. See Annex 6.
1,96%
28,43%
41,18%
28,43%
High income
Low income
Lower middle income
Upper middle income