


 49 / 142

COMCEC Transport and Communications
Outlook 2017
30
3.3.
M
ARITIME
T
RANSPORT
2
While all modes of transport are important, maritime transport needs special attention given
that almost 85% of global trade is carried by sea in terms of weight and thus ports can account
for a significant proportion of trade logistics and transport costs. (COMCEC, 2015)
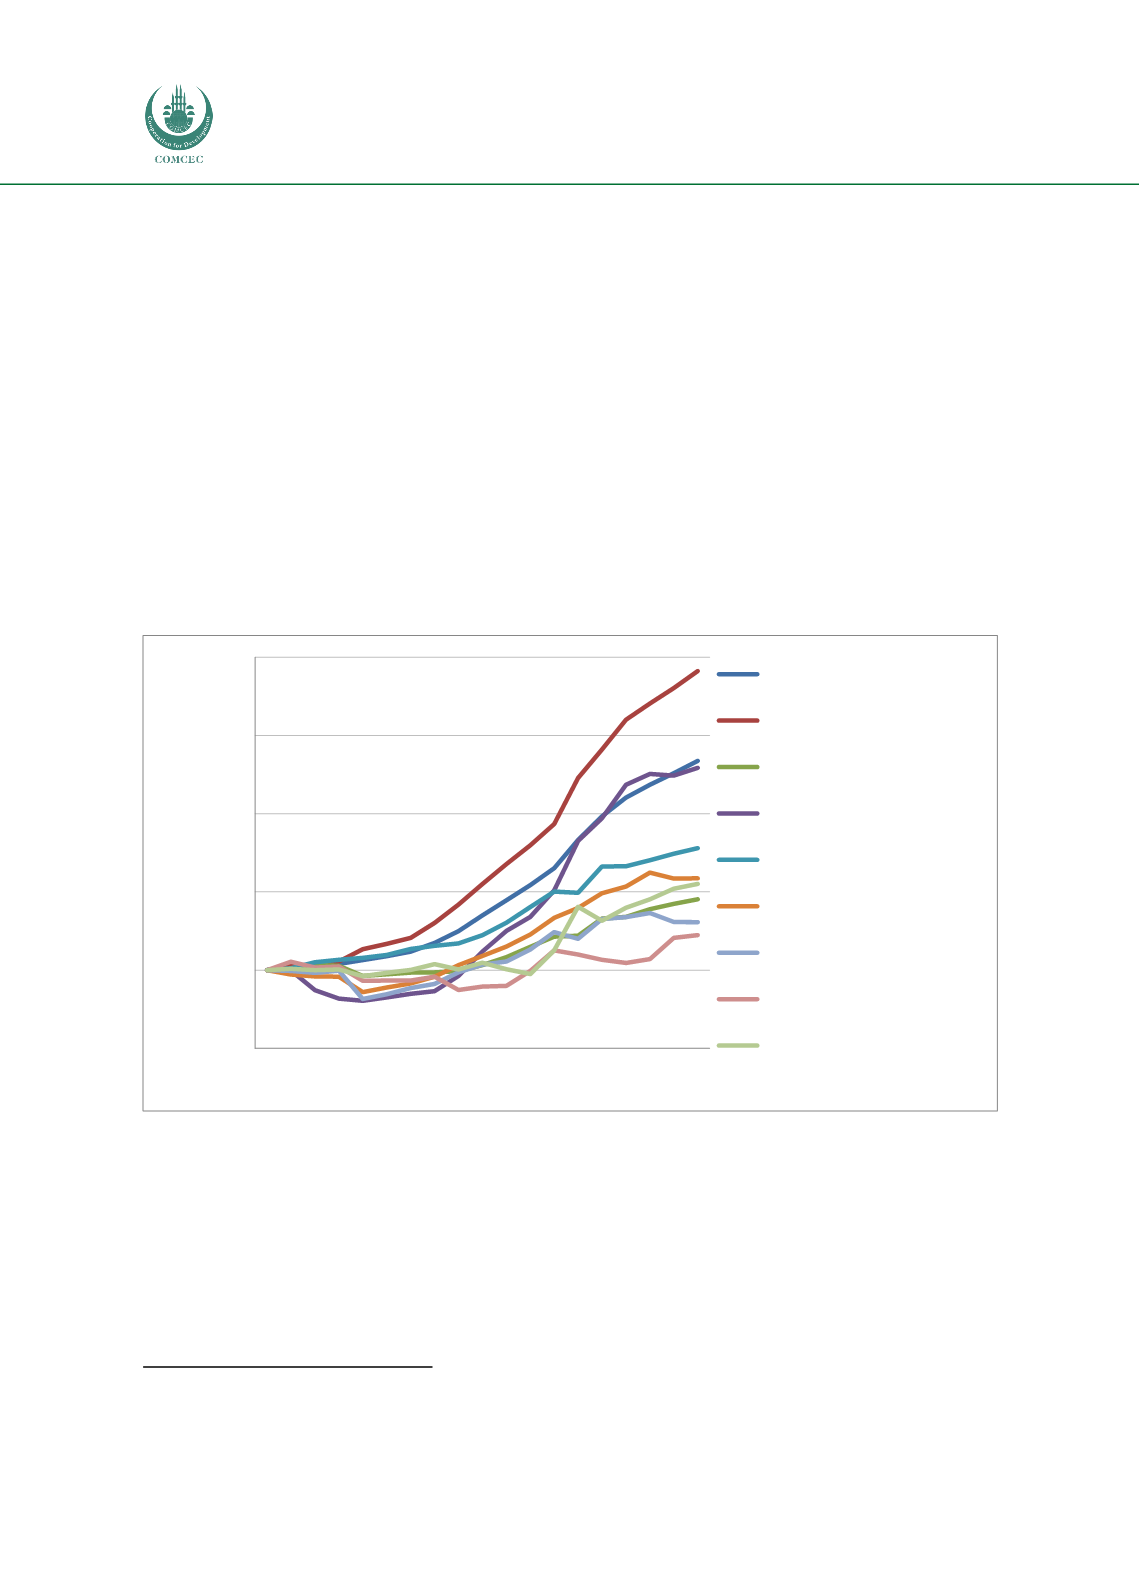
A measure that can be used as a proxy for the international trade is the change in global fleet.
Figure 13 shows, using UNCTAD data, the change in the total fleet, in dead weight tons in
thousands, by flag of registration for the 1998-2016 period. During this 19-year period, world
fleet has increased 134%while only one subgroup, i.e. developing economies, outperformed this
global average with a growth of 191%. The OIC countries failed to catch up with the world
average in fleet growth and increased their fleet only by 55%. Similarly, the League of Arab
States (LAS) fell below the world average and grew its fleet only by 22%.
Figure 13: Change in total fleet by flag of registration (in 1000 dwt) (1998-2016)
Source: Author from UNCTAD Statistical Database
The increase in the commercial fleet registered under the flags of the OIC Member States
corresponds to a total capacity of 70.5 million deadweight tons (dwt) in 2016 compared with 37
million dwt in 1985. The majority of the fleet consist of oil tankers whereas container ships
represent only 8.2% of the total fleet. With regard to their share of the world’s fleet, the
commercial fleet of the OIC countries represents 3.9% in 2016 which was 5.5% 31 years ago.
Considering the comparatively higher share of the OIC countries in the world trade, i.e. around
2
For a more detailed account on the subject, see COMCEC, “Evaluating the Ownership, Governance
Structures and Performances of Ports in the OIC Member Countries”, 2015.
50
100
150
200
250
300
1998
1999
2000
2001
2002
2003
2004
2005
2006
2007
2008
2009
2010
2011
2012
2013
2014
2015
2016
Total fleet index
(value in 1998=100)
World
Developing economies (DE1)
Developed economies (DE2)
LDCs (Least developed
countries)
EU28 (European Union)
G20 (Group of Twenty)
G8 (Group of Eight)
LAS (League of Arab States)
OIC (Organisation of Islamic
Cooperation)