


 21 / 142

COMCEC Transport and Communications
Outlook 2017
13
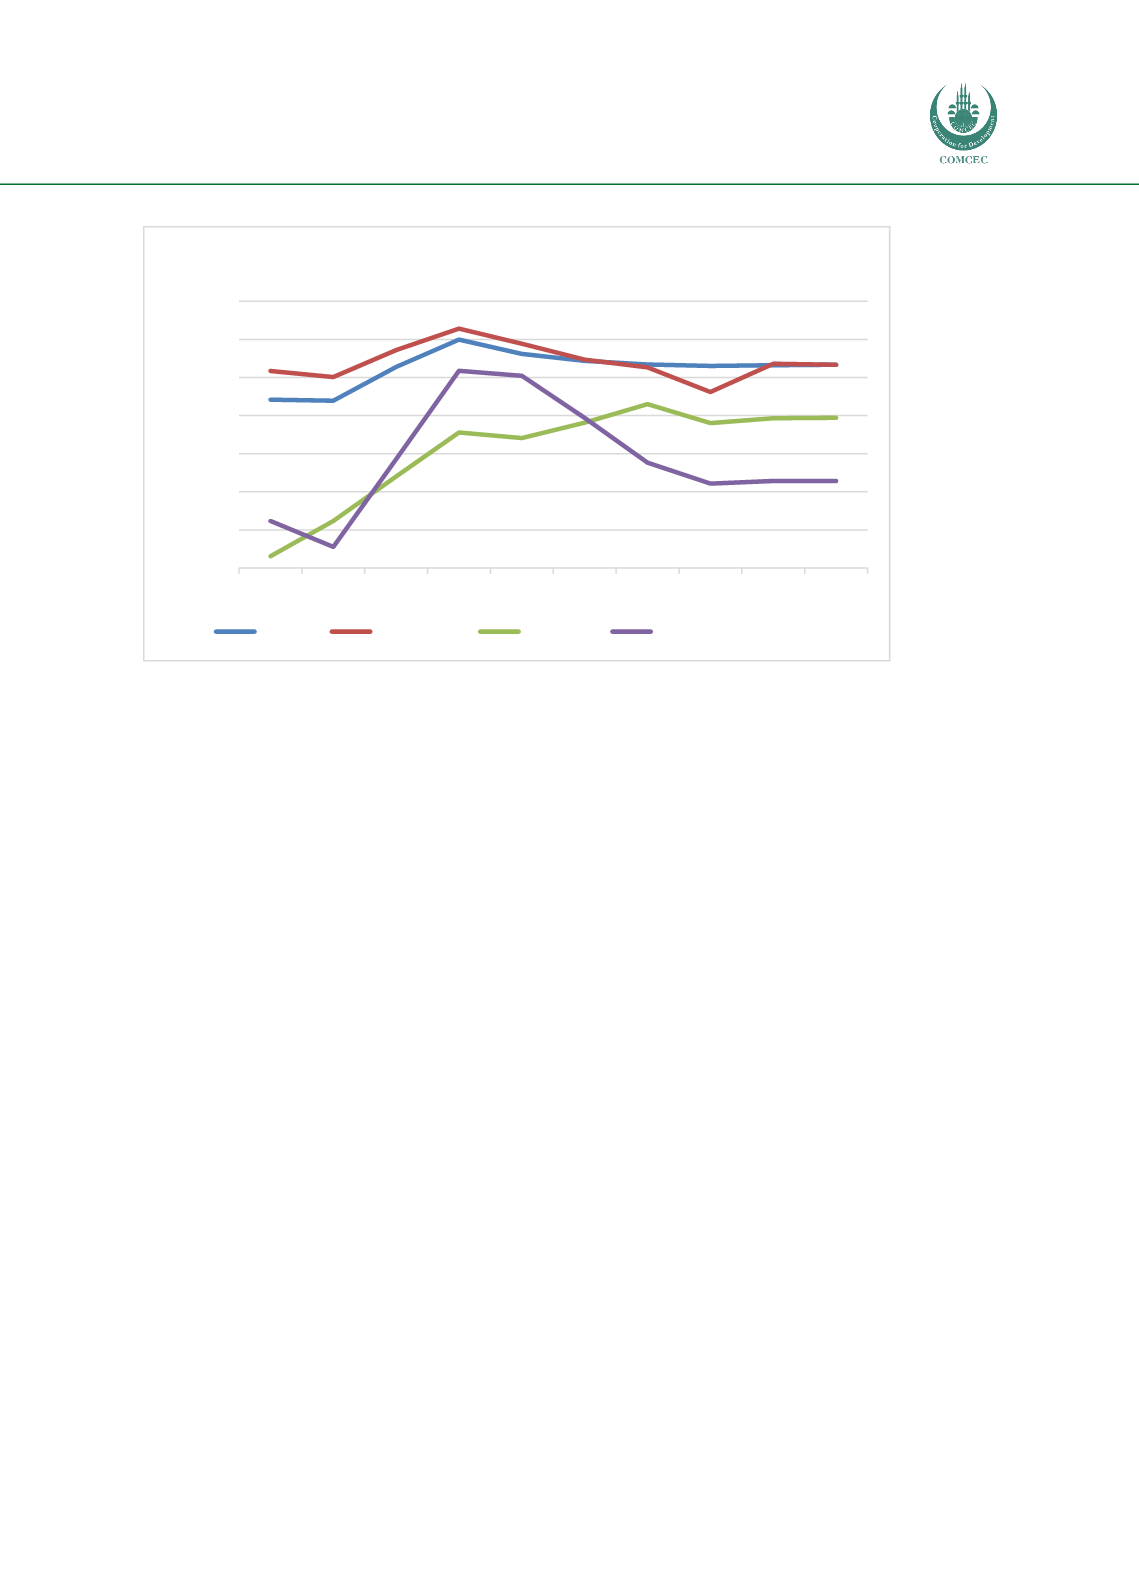
Figure 4: Average burden of custom procedure scores by OIC regions (2007-2016)
Source: Author from the World Bank World Development Indicators
3,0
3,2
3,4
3,6
3,8
4,0
4,2
4,4
2007 2008 2009 2010 2011 2012 2013 2014 2015 2016
Burden of Custom Procedures
(
1=extremely inefficient to 7=extremely efficient
)
World
OIC-MENA
OIC-Asia
OIC-Sub Saharan Africa