


 20 / 142

COMCEC Transport and Communications
Outlook 2017
12
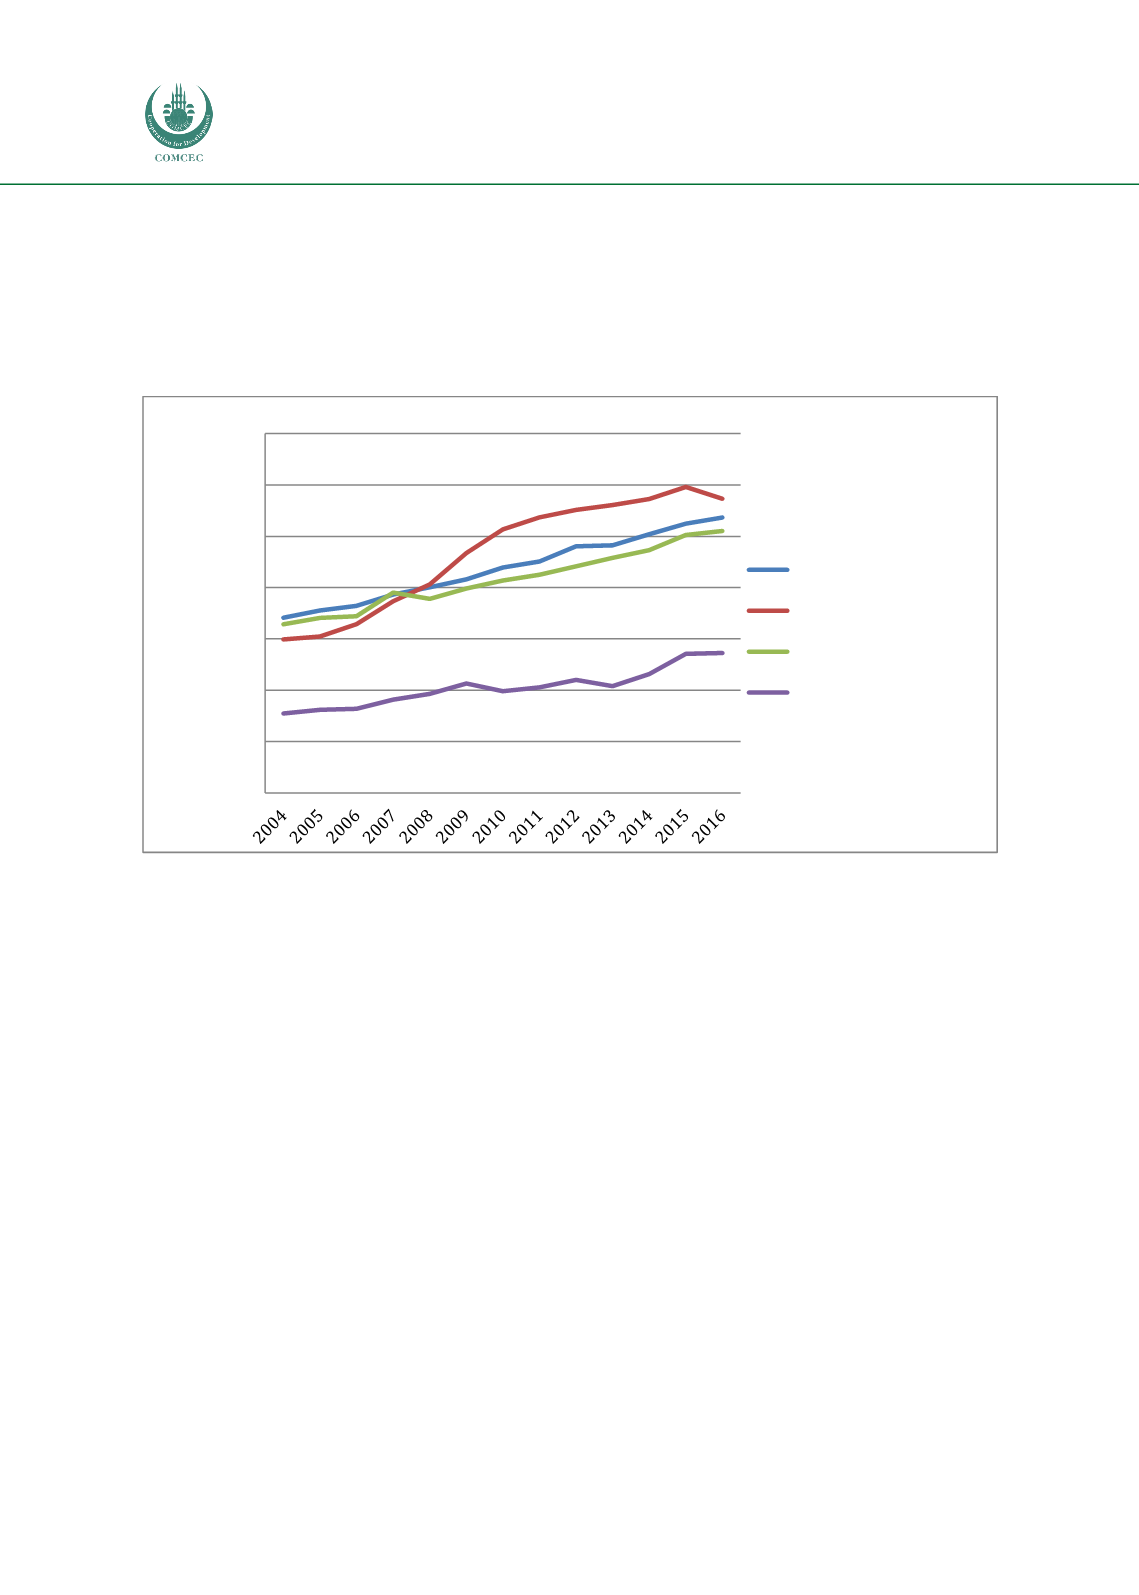
Figure 3 provides, on average, the LSCI changes for the OIC-groupings between 2004 and 2016.
As the figure suggests, in terms of average LSCI scores, OIC-MENA region performed better than
OIC-Asia region as well as the world starting from 2008. On the other hand, average LSCI scores
for OIC-Sub-Saharan Africa region remained well below the world averages throughout the
same period.
Figure 3: Average liner shipping connectivity scores by OIC regions (2004-2016)
Source: Author from UNCTAD Statistical Database
Lastly, custom procedures were analysed for the three OIC regions as they directly affect trade
facilitation. For this purpose, burden of custom procedures index, which is provided by the
World Bank, were examined on a scale of 1 to 7, where 7 corresponds to the extremely efficient
case. Figure 4 reveals that although it fell behind the world averages between 2012 and 2015,
OIC-MENA has been the best performing OIC region for the 2007-2016 period in terms of
efficiency of customprocedures. Although OIC-Asia has experienced a steady growth throughout
this period both OIC-Asia and OIC-Sub-Saharan Africa had custom efficiency scores below the
world average.
0
5
10
15
20
25
30
35
Liner Shipping Connectivity İndex
(maximum value in 2004=100)
World
OIC-MENA
OIC-Asia
OIC-Sub-Saharan Africa