


 20 / 144

COMCEC Transport and Communications
Outlook 2018
12
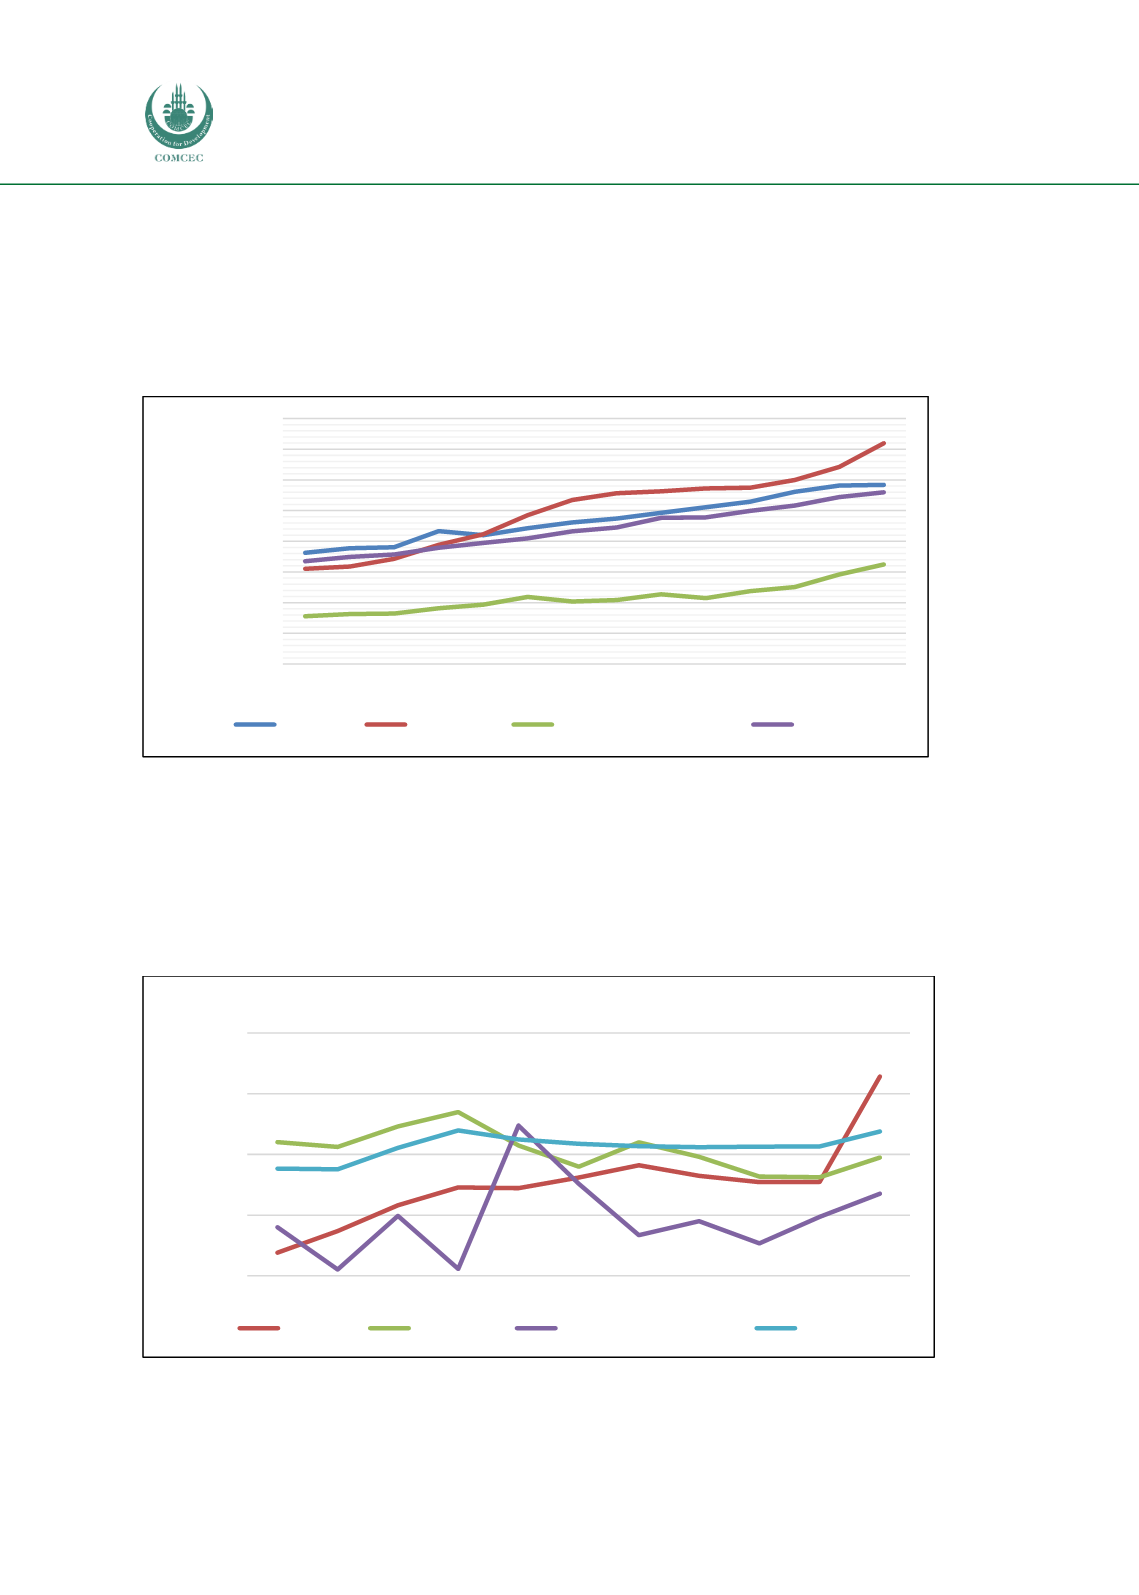
Figure 3 provides, on average, the LSCI changes for the OIC-groupings between 2004 and 2017.
As the figure suggests, in terms of average LSCI scores, OIC-MENA region performed better than
OIC-Asia region as well as the world starting from 2008. On the other hand, average LSCI scores
for OIC-Sub-Saharan Africa region remained well below the world averages throughout the
same period.
Figure 3: Average liner shipping connectivity scores by OIC regions (2004-2017)
Source: Author from UNCTAD Statistical Database
Lastly, custom procedures were analysed for the three OIC regions as they directly affect trade
facilitation. For this purpose, burden of custom procedures index, which is provided by the
World Bank, were examined on a scale of 1 to 7, where 7 corresponds to the extremely efficient
case. Figure 4 reveals a very fluctiative pattern for the custom performance of the OIC regions.
Figure 4: Average burden of custom procedure scores by OIC regions (2007-2017)
Source: Author from the World Bank World Development Indicators
0
5
10
15
20
25
30
35
40
2004 2005 2006 2007 2008 2009 2010 2011 2012 2013 2014 2015 2016 2017
Liner Shipping Connectivity
Index
(maximum values in 2004=100)
OIC Asia
OIC MENA
OIC Sub-Saharan Africa
World
3
3,5
4
4,5
5
2007 2008 2009 2010 2011 2012 2013 2014 2015 2016 2017
Burden of custom procedures
(1=extremely inefficient to 7=extremely efficient)
OCI Asia
OIC MENA
OIC Sub-Saharan Africa
World