


 17 / 144

COMCEC Transport and Communications
Outlook 2018
9
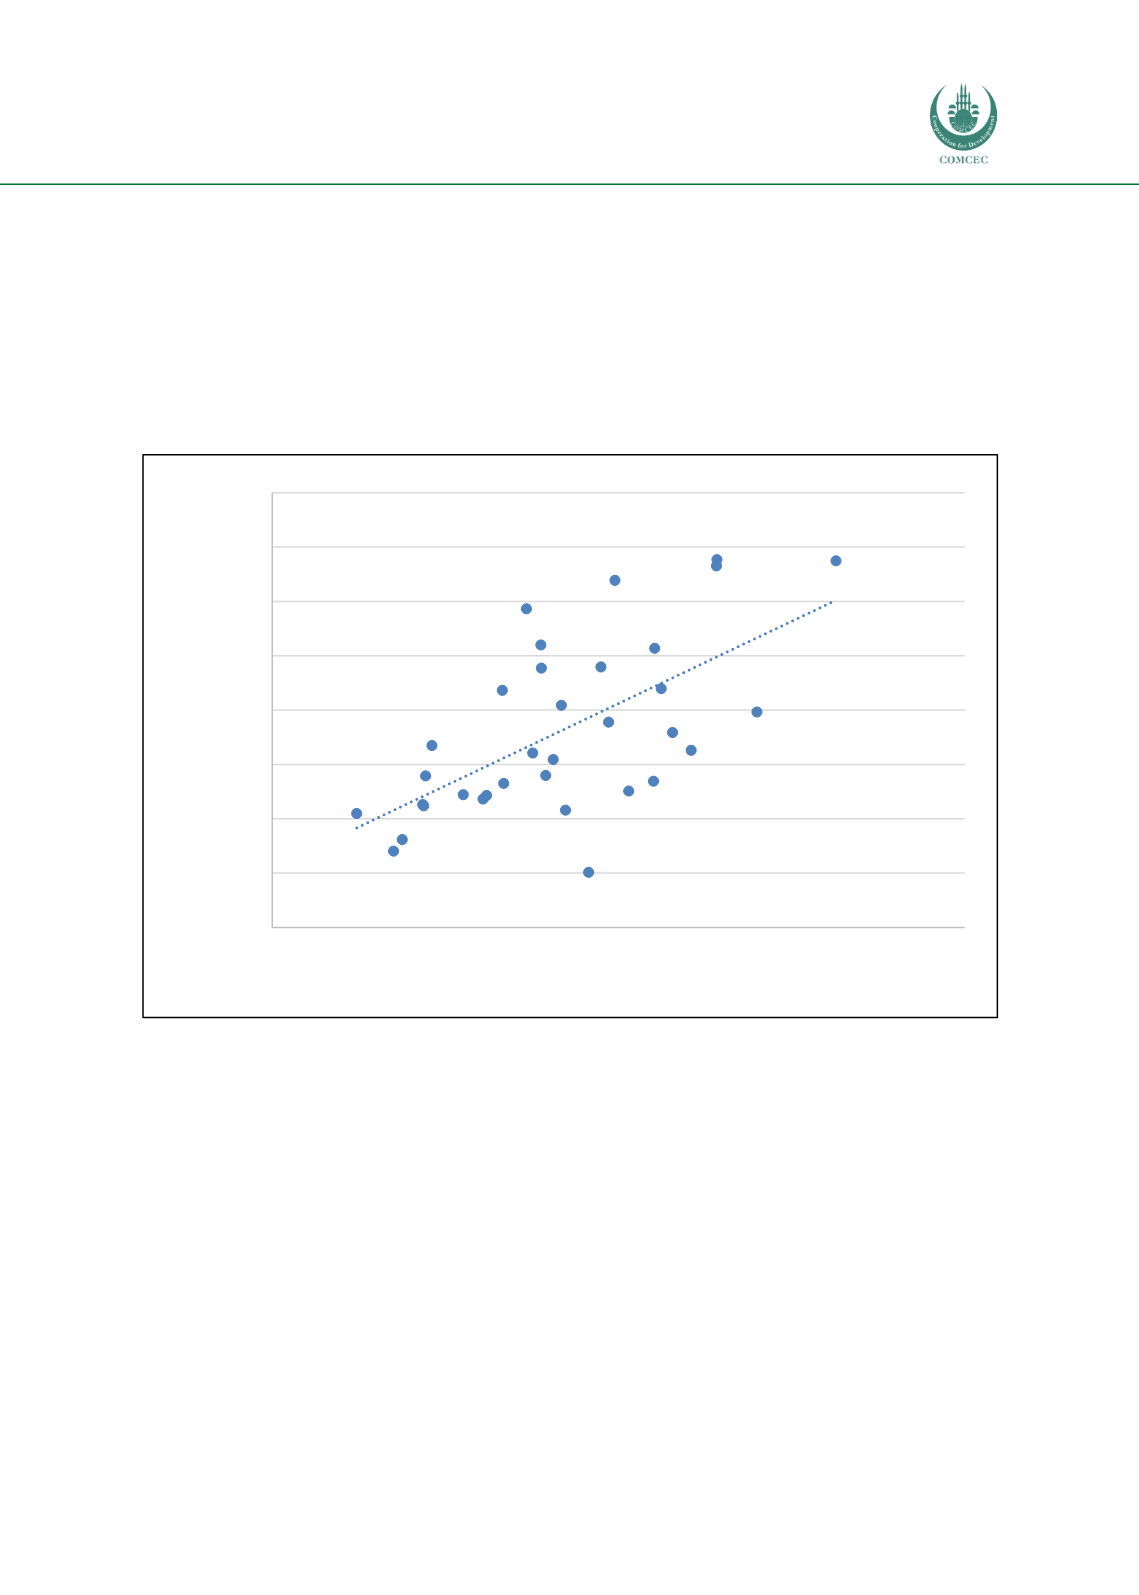
As an evidence of this fact, Figure 1 shows the LPI scores of the OIC countries for the year 2016
and their respective international merchandise trade (excluding fuel exports) for the year 2014.
The figure reveals that there is a positive correlation between the LPI scores and international
merchandise trade (excluding oil exports) of the OIC countries. This might imply that if an OIC
country has a high LPI score this gives it a competitive advantage over those with lower LPI
scores as it can facilitate its international trade through its enhanced logistics infrastructure and
services.
Figure 1: Total merchandise trade (exc. oil exports) and LPI scores in OIC countries (2016)
Source: Author from the World Bank World Development Indicators
Figure 2 shows this relation for the 35 OIC countries where the horizontal axis exhibits the 2016
LPI scores and the vertical axis presents their Global Competitiveness Index (GCI) scores,
published by the World Economic Forum (2016), for the period 2016-2017. The figure shows
that there is a positive correlation between the LPI and GCI scores of the OIC countries.
Algeria
Bahrain
Bangladesh
Benin
Brunei Darussalam
Cameroon
Chad
Egypt
Gabon
Indonesia
Iran
Jordan
Kazakhstan
Kuwait
Malaysia
Mali
Mauritania
Morocco
Mozambique
Nigeria
Oman
Pakistan
Qatar
Saudi Arabia
Sierra Leone
Tajikistan
Tunisia
Turkey
Uganda
UAE
19,00
20,00
21,00
22,00
23,00
24,00
25,00
26,00
27,00
1,50
2,00
2,50
3,00
3,50
4,00
4,50
ln Merchandise Trade (exc. Fuel Exports)
(current US$) (2014)
Overall LPI Score 2016