


 20 / 56

COMCEC Tourism Outlook-2018
10
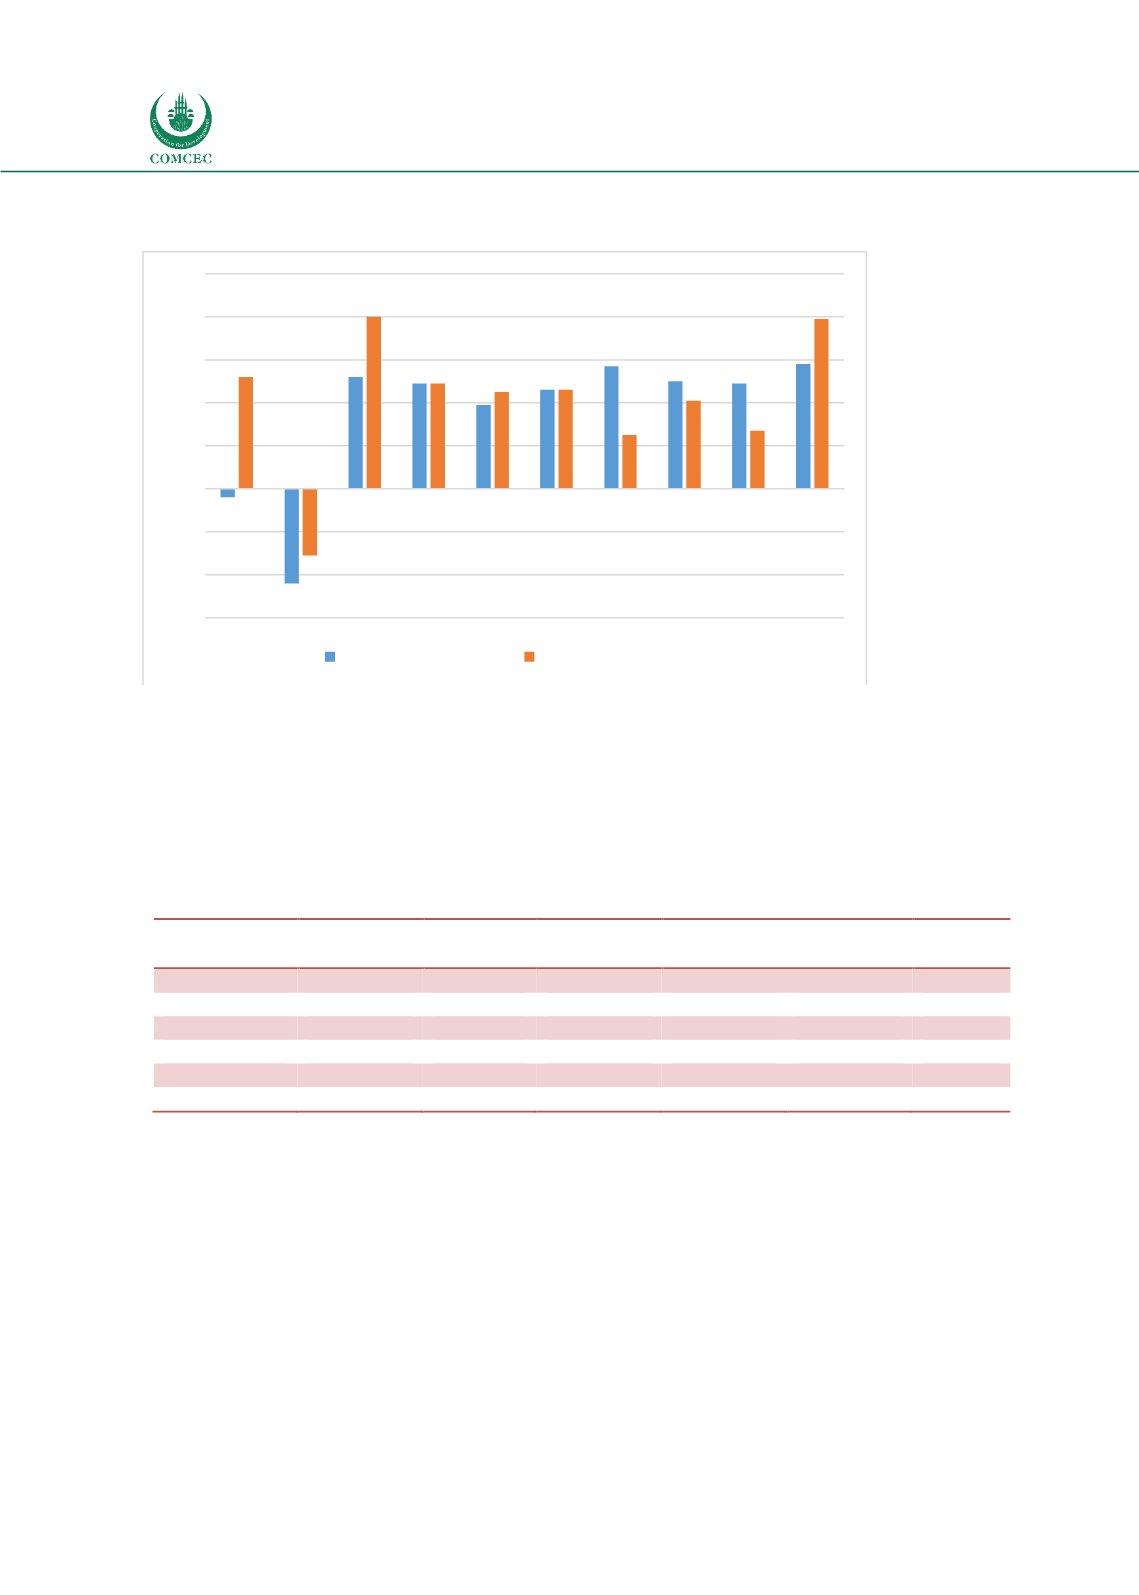
Figure 0.3 Change in International Tourist Arrivals (%)
Source: World Tourism Organization, Tourism Barometer 2017 July &Tourism Highlights 2017
In terms of regions, the UNWTO reports that Africa (+9%) was the best performer in 2017 and
the number of international tourists grew by 5 million to reach 63 million in this region. Growing
purchasing power, relative safety, increased air connectivity, more affordable travel and visa
relaxation arrangements were major reasons of the growth.
Table 0.2 International Tourism Arrivals by Region (Millions)
Tourist
Arrivals
2000
2010
2015
2016
2017
Share
(%)
World
674
949
1.186
1.235
1.323
100
Europe
386.4
488.7
607.6
616
671
51
Asia&Pacific
110.3
205.4
279.2
308
323
24
Americas
128.2
150.1
192.6
200
207
16
Africa
26.2
49.7
53.5
58
63
5
Middle East
22.4
54.8
53.3
54
58
4
Source: World Tourism Organization, 2018a
According to the Table 3.2,
Europe
(+2%),
Asia and the Pacific
(+9%),
the Americas
(+3%),
Africa
(+8) showed continued growth in 2016 except
Africa
(-4%).
In 2017, Europe (+8%) hosted more than half of the international tourists (671 million). This is
an increase of 52 million from 2016. Asia and the Pacific recorded 15 million more international
tourist arrivals compared to 2016 to reach 323 million. International tourist arrivals in the
Americas grew 7 million to reach 207 million. Limited data available for Africa points to an
estimated 9% increase corresponding to 5 million more arrivals which confirms a strong
recovery partly due to simpler visa procedures, air and sea connectivity and strengthening
security.
-6,0
-4,0
-2,0
0,0
2,0
4,0
6,0
8,0
10,0
08/07 09/08 10/09 11/10 12/11 13/12 14/13 15/14 16/15 16/17
Advanced Economies
Emerging Economies