


 22 / 56

COMCEC Tourism Outlook-2018
12
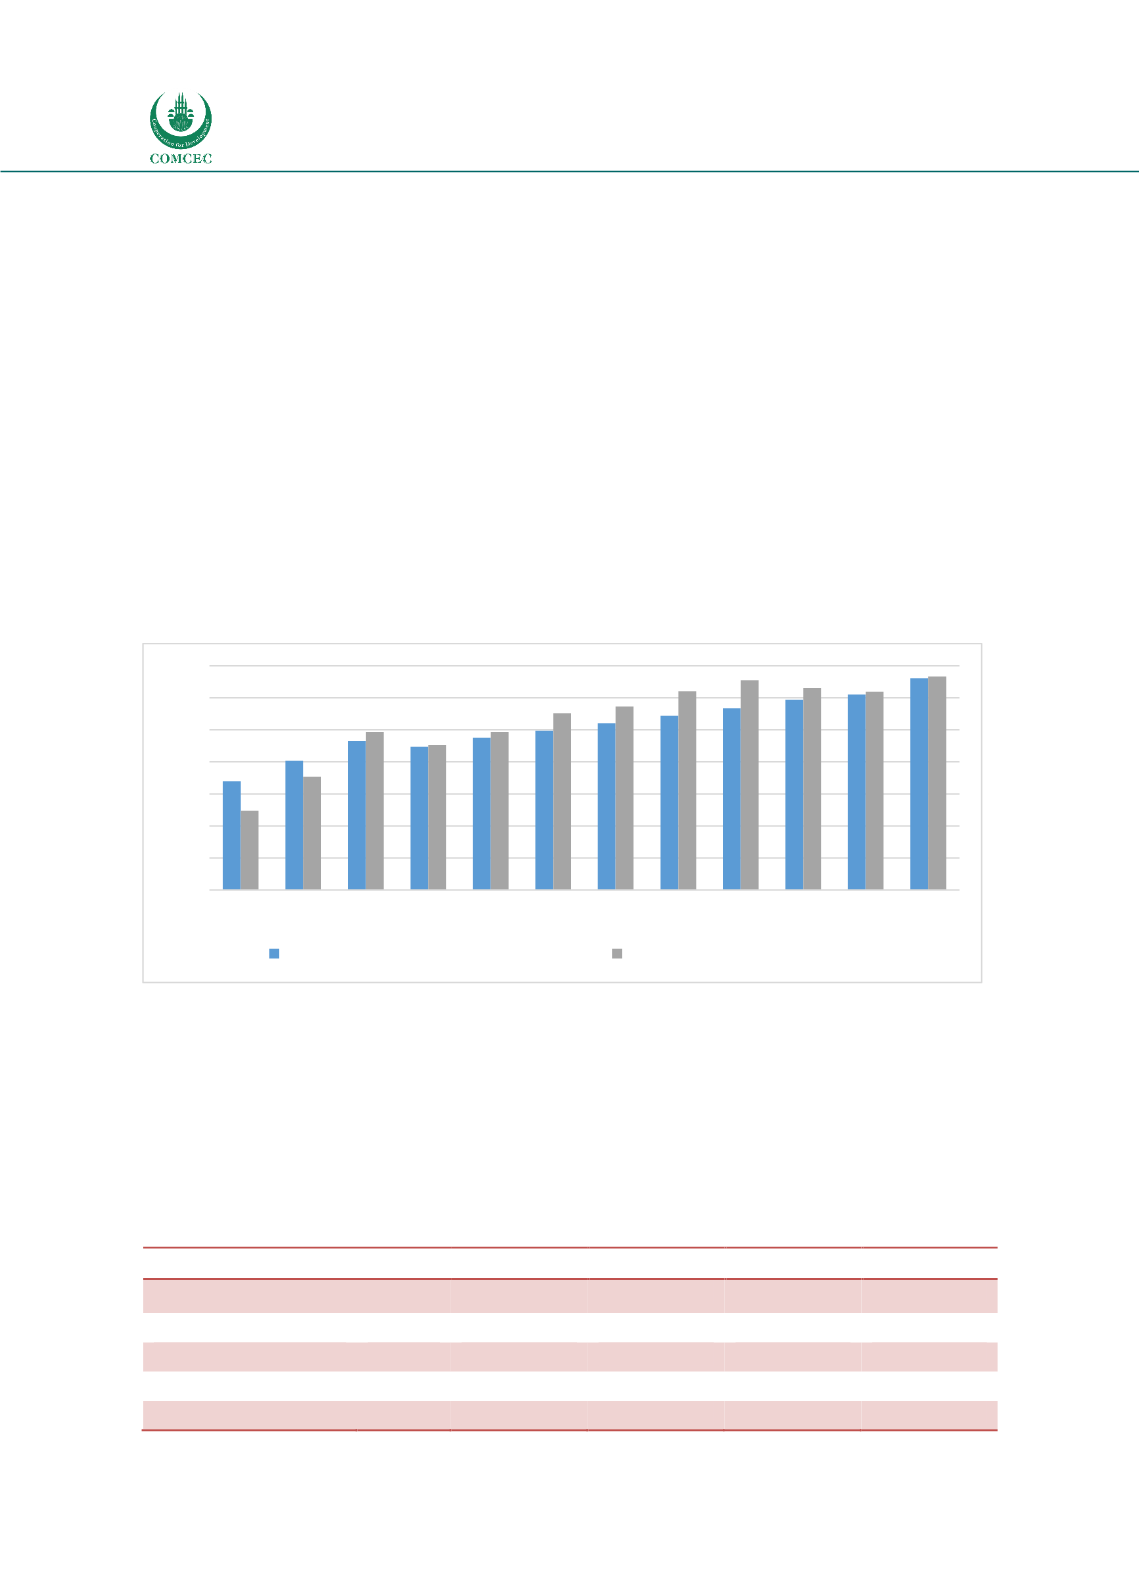
Figure 3.5 shows the international tourism receipts as well as tourist arrivals for the period
2005-2017. International tourism receipts grew by 5 % in real terms (i.e. using local currencies
at constant prices in order to adjust for inflation and exchange rate fluctuations) in 2017 by
reaching to US$ 1,332 billion. The strong exchange rate fluctuations in 2016 and 2017
significantly influenced receipts for individual destinations and regions expressed in current US
dollars. In absolute terms, international tourism receipts in destinations around the world
decreased by US$ 94 billion compared to 2016. 64 of 112 destinations sawwhich have observed
an increase 64 recorded double digits.
In addition to receipts earned in the destinations (the travel item of the balance of payments),
international tourism also generated US$ 216 billion in exports through international passenger
transport services rendered to non-residents in 2016. As such, total receipts from international
tourism, including international passenger transport, might be expected to exceed US$ 1.5
trillion in 2017 resulting a contribution of US$ 4 billion a day to global export earnings.
Figure 0.4 International Arrivals & Tourism Receipts (2005-2017)
Source: UNWTO, 2018a
Based on 2016 data, advanced economy destinations (+1.6%) recorded somewhat slower
growth also in receipts than emerging economy destinations (+4.4%). By region, the largest
increase in receipts for the Middle-East was recorded as +13% (in real terms) in 2017. It is
followed by Africa and Europe by +8%, Asia & Pasific by +4% and Americas by 1%.
Table 0.3 International Tourism Receipts by Region (Billion $)
Tourism Receipts
2000
2015
2016
2017
Share (%)
World
475
1,196
1,220
1,332
100
Europe
234.5
449.6
447.3
511.6
38.4
Asia & Pacific
86.7
349.4
366.7
389.5
29.2
Americas
132.8
305.6
313.2
325.7
24.5
Africa
10.8
32.8
34.8
37.8
2.8
0
200
400
600
800
1000
1200
1400
2000 2005 2008 2009 2010 2011 2012 2013 2014 2015 2016 2017
Number of tourists (millions of people)
Tourism receipts (billion dollars)