


 54 / 113

COMCEC Trade Outlook 2017
45
associated with exporting, thereby increasing the number of firms which are export competitive
(Jayawera 2009). Spalla (2010) also suggests that FDIs contribute to international
competitiveness of the domestic firms through transfer of the know-how and technology.
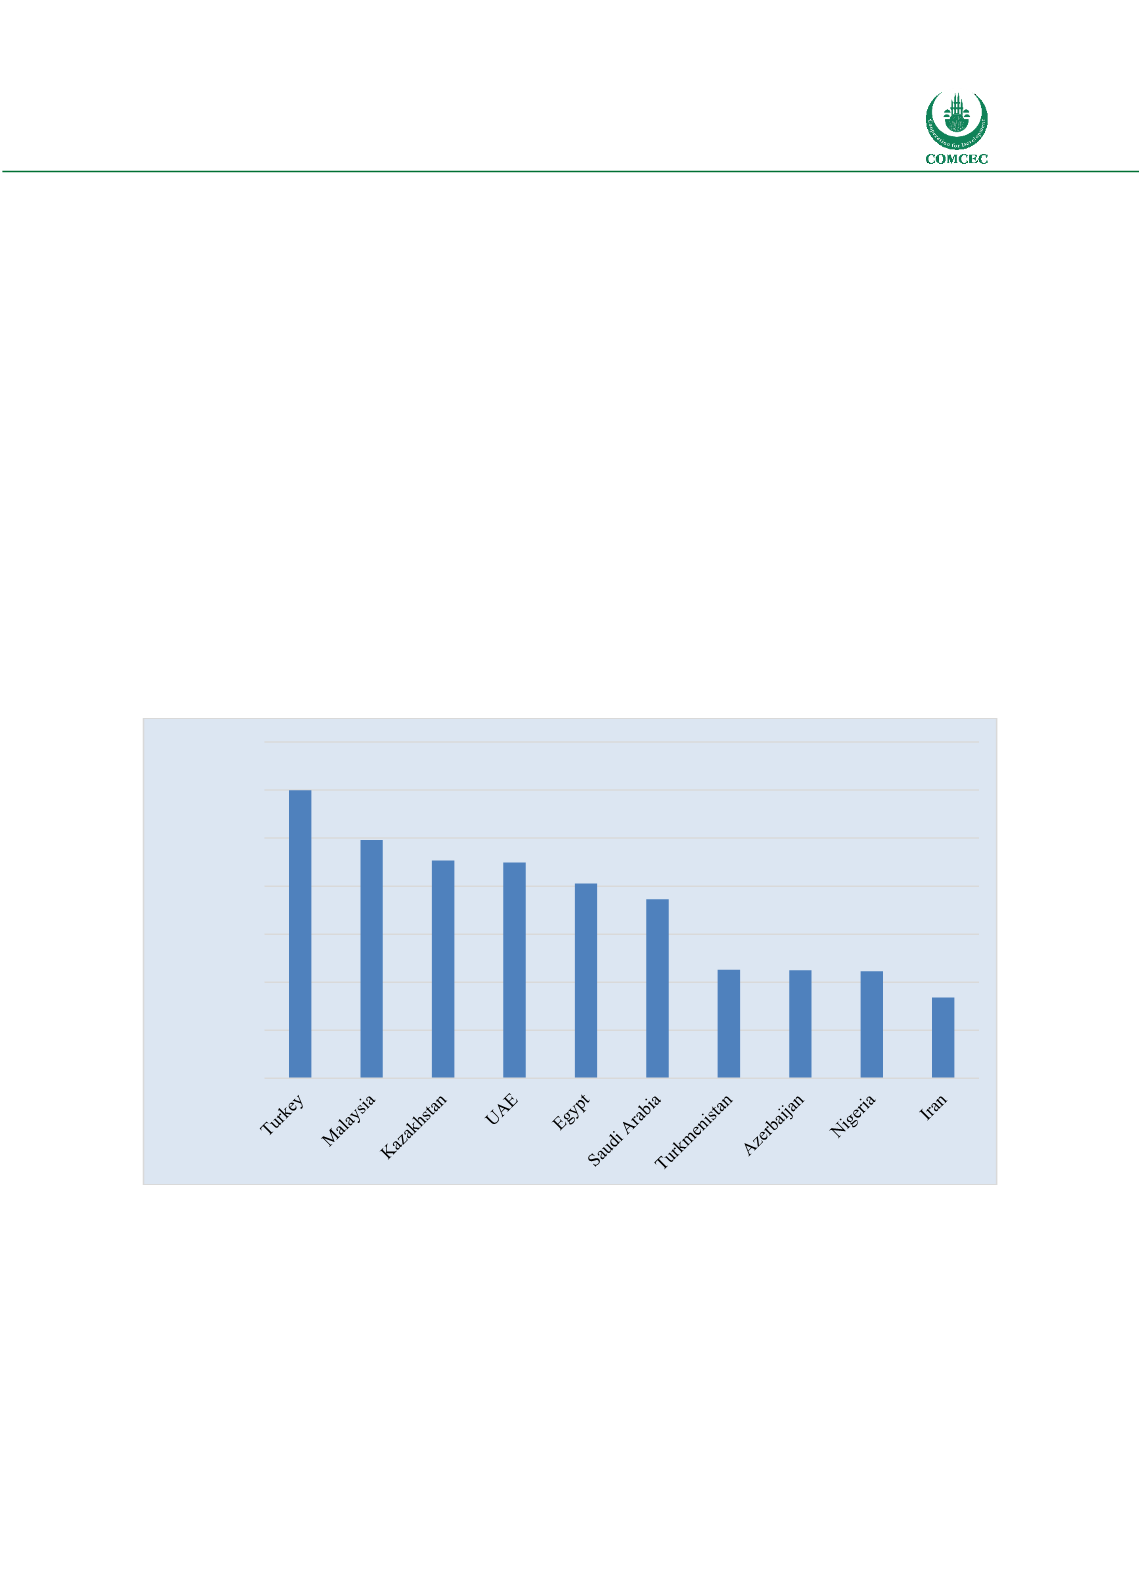
The performance of the OIC countries, except for a few countries in attracting the FDI, is low.
Figure 47 below gives the FDI inflows to top ten OIC Member States. FDI inflows to these
countries amounted to USD 72.4 billion in 2016 according to the UNCTAD, representing 75
percent of the total FDI inflows to the OIC Member States. The other remaining 47 countries
attracted nearly USD 24 billion FDI in 2016.
Another obstacle faced by most of the Member States is the concentration of the export oriented
FDIs on traditional sectors. Harding and Javorcik (2011) underlined that, if the FDI exports are
only products that the host country already exports intensively, the efficiency-seeking FDI could
move towards more specialized rather than more diversified exports. Thus, FDI does not
contribute too much to export diversification. For example according to UNCTAD (2011), which
investigated the sectorial distribution of the FDIs in LDCs, m
any large projects are in the form of
greenfield and expansion projects prospecting for reserves of base metals and oil. The study also
cited the lack of political stability and unavailability of skilled workers as main reasons for low
performance of investment in the manufacturing sector in Africa.
Figure 47: Top OIC Countries Receiving the Highest FDI Inflows in 2016
Source: UNCTADSTAT
-
2,000
4,000
6,000
8,000
10,000
12,000
14,000
Million Dollars