


 57 / 133

COMCEC Trade Outlook 2018
49
Figure 57: World Foreign Direct Investment Inflows and Shares of Country Groups
Source: UNCTAD World Investment Report 2018
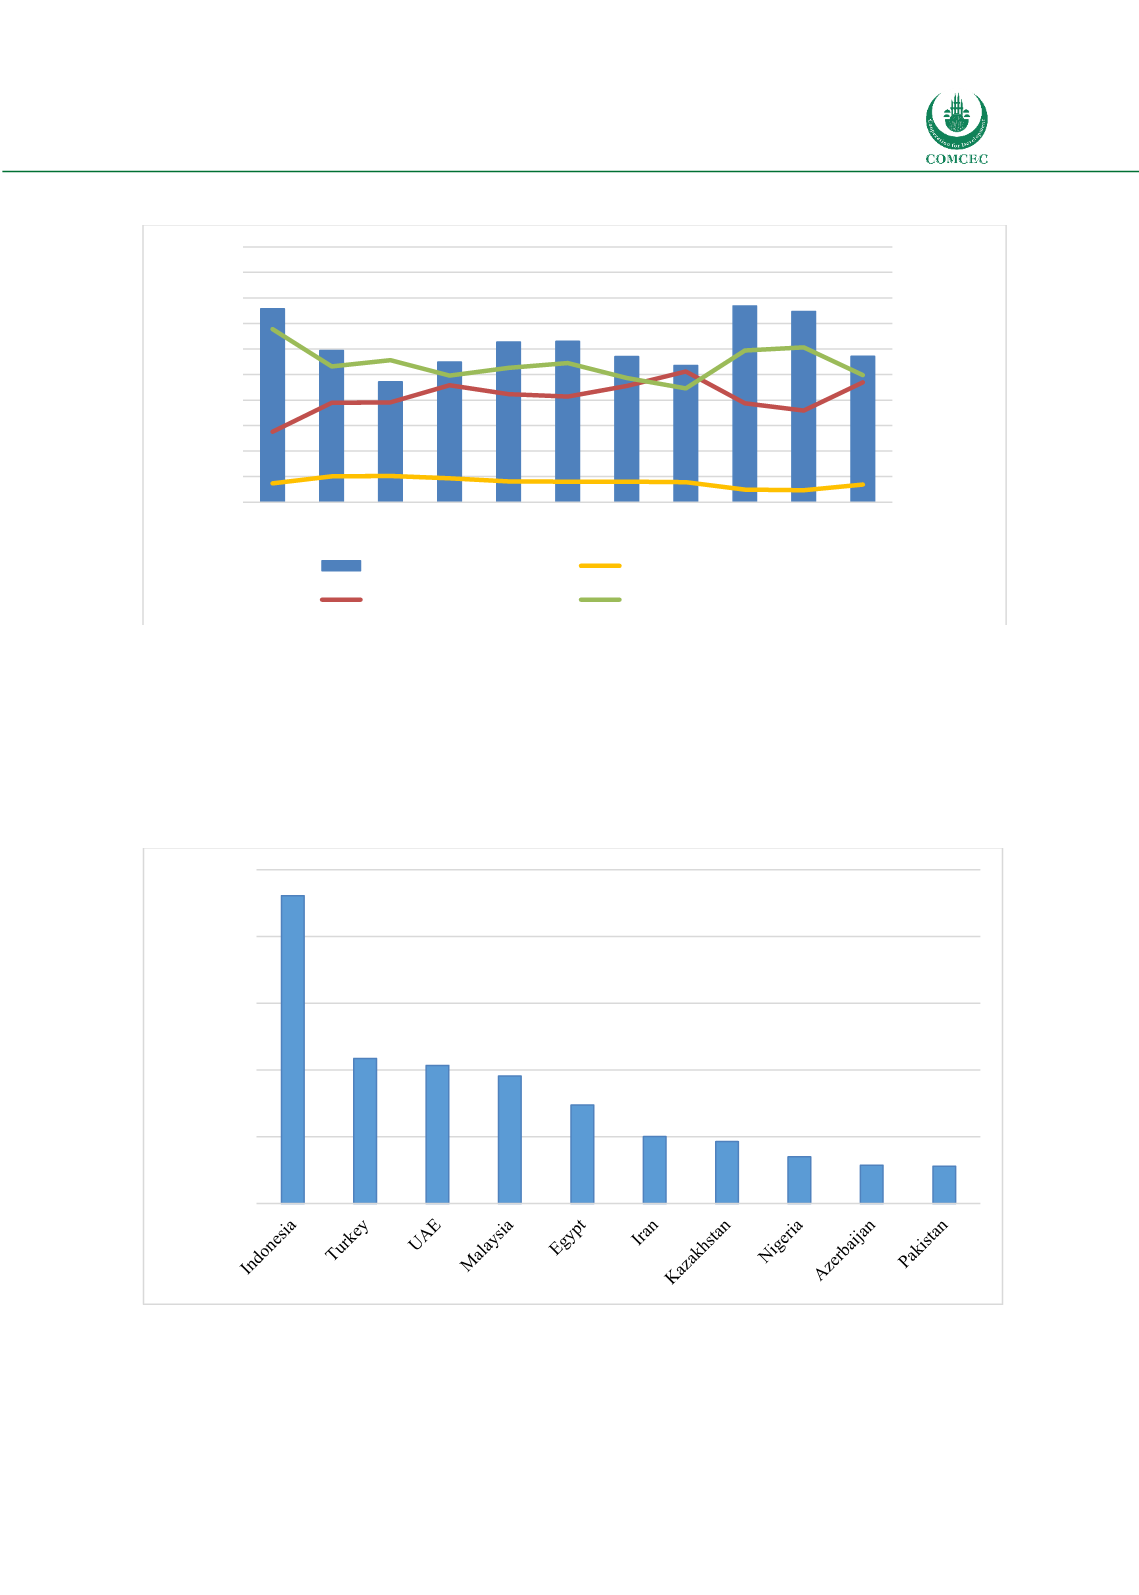
When looked into detail the performance of the OIC countries in attracting the FDI, the
performance of the Member Countries, except for a few countries, is low. Figure 58 below gives
the FDI inflows to top ten OIC Member States. FDI inflows to these countries amounted to USD
80.0 billion in 2017, representing 71 percent of the total FDI inflows to the OIC Member States.
The other remaining 45 countries where the data is available attracted nearly USD 26.9 billion
FDI in 2017.
Figure 58: Top OIC Countries Receiving the Highest FDI Inflows in 2017
Source: UNCTADSTAT
0
500
1,000
1,500
2,000
2,500
0
10
20
30
40
50
60
70
80
90
100
2007 2008 2009 2010 2011 2012 2013 2014 2015 2016 2017
billions of dollars
per cent
world FDI inflows
OIC Countries' share
Developing Countries' share
Developed Countries' share
0
5,000
10,000
15,000
20,000
25,000
Million USD