


 88-89 / 94

60
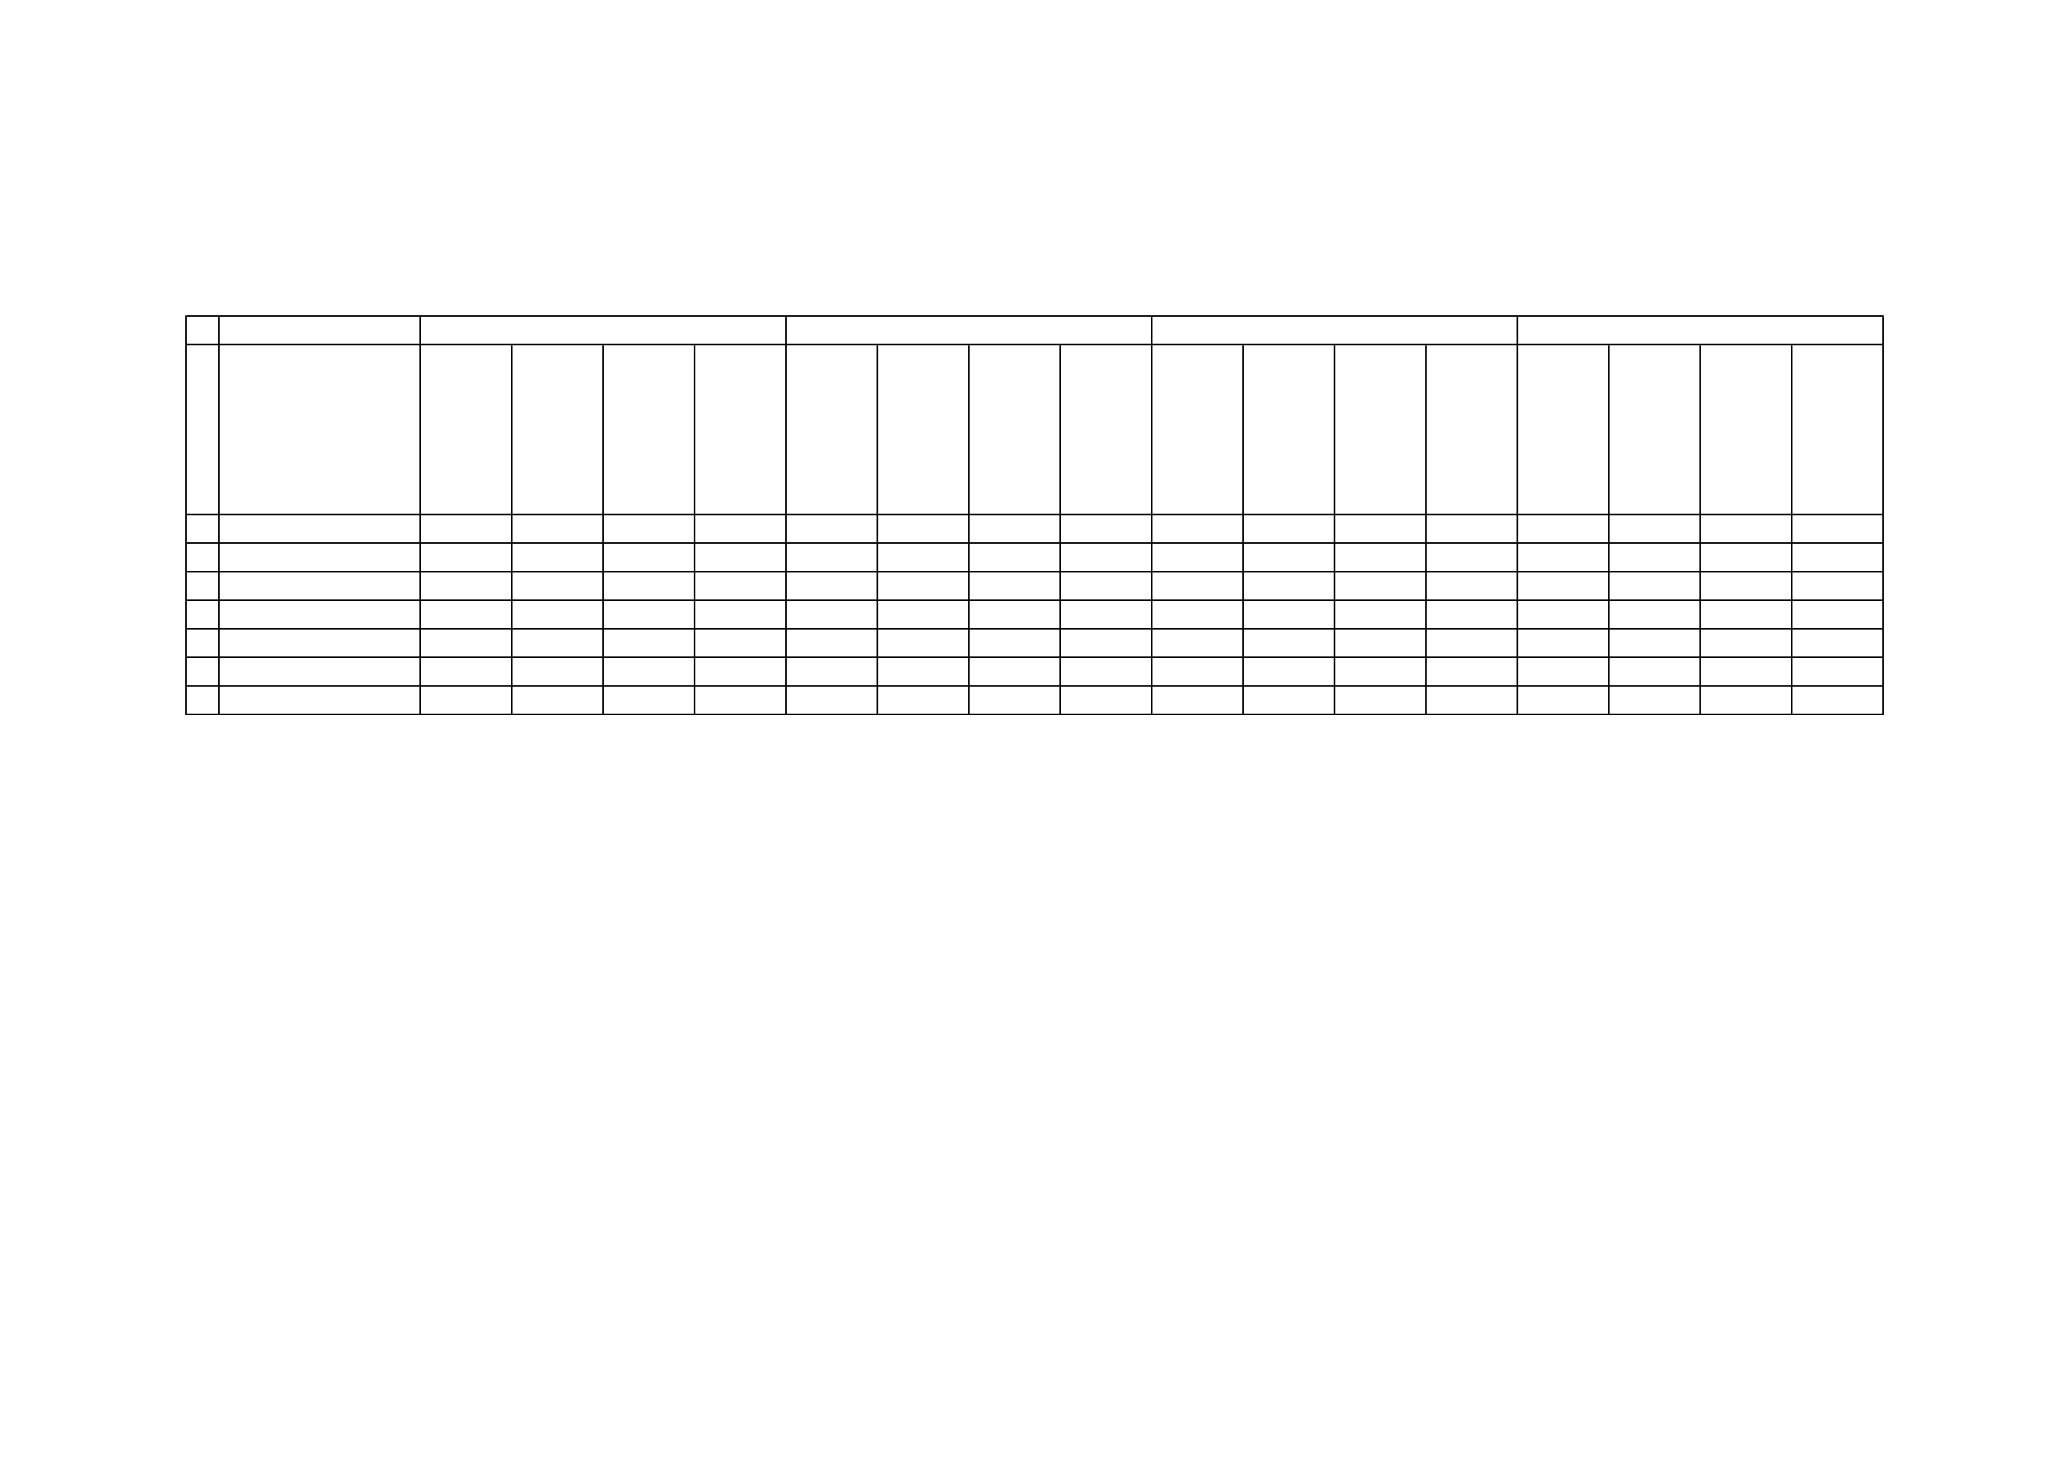
Table 18: Selected Financial Data on HIGH-OIC Member States (2015)
Source: The World Bank Database
Categories
High-Income Group
(OIC-HIG)
Private
credit by
deposit
money
banks to
GDP (%)
Deposit
money
banks'
assets to
GDP (%)
Stock
market
capitalizat
ion to GDP
(%)
Stock
market
total value
traded to
GDP (%)
Bank
accounts
per 1,000
adults
Bank
branches
per
100,000
adults
Firms
with a
bank loan
or line of
credit (%)
Saved at a
financial
institution
in the past
year (%
age 15+)
Bank
lending-
deposit
spread
Bank
return on
assets (%,
after tax)
Bank
return on
equity (%,
after tax)
Stock
market
turnover
ratio (%)
Bank
nonperfor
ming
loans to
gross
loans (%)
Bank
capital to
total
assets (%)
Bank
credit to
bank
deposits
(%)
Bank
regulatory
capital to
risk-
weighted
assets (%)
1 Bahrain
70,2 101,3
66,7
1,6
-
-
-
-
4,2
1,2
9,5
1,4
4,4
13,5
88,6
18,7
2 Brunei Darussalam 40,2
45,6
-
-
1537,0 20,3
-
3,0
5,2
1,5
13,7
-
0,4
13,2
53,7
21,6
3 Kuwait
95,0
99,5
-
-
1210,1 14,8
-
-
2,3
1,1
9,1
-
2,8
11,1
99,6
16,9
4 Oman
59,8
72,1
56,4
6,7
-
13,6
-
-
2,8
1,5
12,1
9,0
1,8
13,4 124,8
16,2
5 Qatar
63,6 121,7
99,9
24,1 784,0
12,4
-
-
2,8
2,0
15,5
14,7
1,6
-
75,9
15,6
6 Saudi Arabia
54,2
66,3
70,0
77,8 961,9
8,9
-
-
-
2,0
14,6
96,6
1,2
13,7 133,6
18,1
7 United Arab Emirates
74,0 102,7
54,1
27,5
-
-
-
-
-
1,8
13,3
28,8
5,2
-
89,7
18,3
Financial Depth
Financial Access
Financial Efficiency
Financial Stability