


 133 / 148

Child and Maternal Mortality
in Islamic Countries
122
Health Expenditure: IRAQ
Overall, the data (Table 3.4) on health financing in Iraq shows an increase in GDP and CHE per
capita from 2005 to 2016. The share of OOPS has also increased from 30% to 78% of the GDP,
while the government expenditure (GGE) has only decreased during the same period. For years,
the sources of health expenditure in Iraq comprised mainly of domestic public and out-of-
pocket. Rapid increasing trends in OOPS may deter Iraqis to seek health care. Yearly trends in
the current health Expenditure by revenue sources and Domestic Government Expenditure and
Health Prioritization indicators are shown in Figure 3.70 and 3.71, respectively.
Table 3. 4 Key figures of current health expenditure indicators in Iraq
YEAR
2005
2010
2016
GDP PER CAPITA US$
3,204
3,605
4,609
CHE PER CAPITA US$
93
116
153
GGHED%CHE
70%
74%
21%
GGHED%GDP
2.0%
2.4%
0.7%
OOPS%CHE
30%
26%
78%
GGE%GDP
63%
50%
41%
GGHED%GGE
3%
5%
2%
POPULATION
226,712,736
242,524,128
261,115,456
Source: WHO Global Health Expenditure Database.
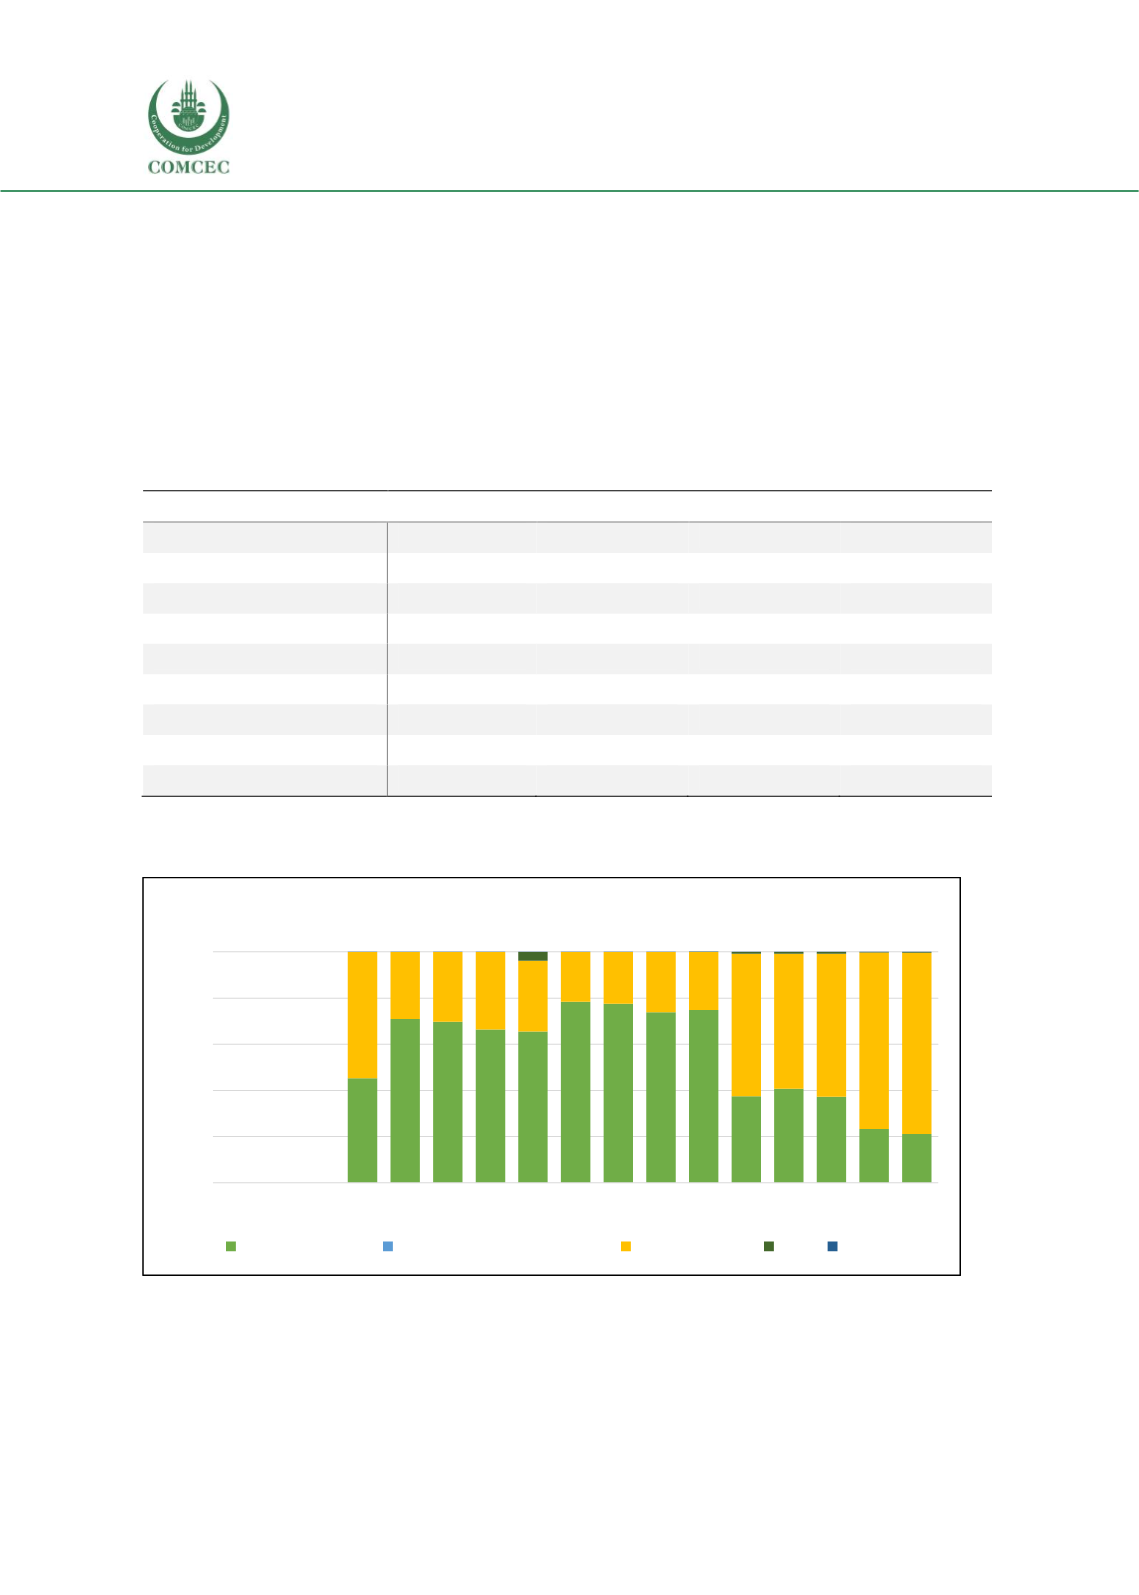
Figure 3.70 Current health Expenditure by revenue sources
Source: WHO Global Health Expenditure Database
0%
20%
40%
60%
80%
100%
2000 2001 2002 2003 2004 2005 2006 2007 2008 2009 2010 2011 2012 2013 2014 2015 2016
Iraq: Current Health Expenditure (By Revenue Sources)
Domestic public
Voluntary health insurance Out-of-pocket
Aid Other