


 63 / 108

55
pressure and obesity as well as NCDs including diabetes are on the rise. The probability of dying from
cardiovascular diseases, cancer, diabetes or chronic respiratory disease between the age of 30 and 70
years in 2015 was 26.6 per cent in Indonesia compared to 23.3 per cent in South Asia overall (WHO,
2017).
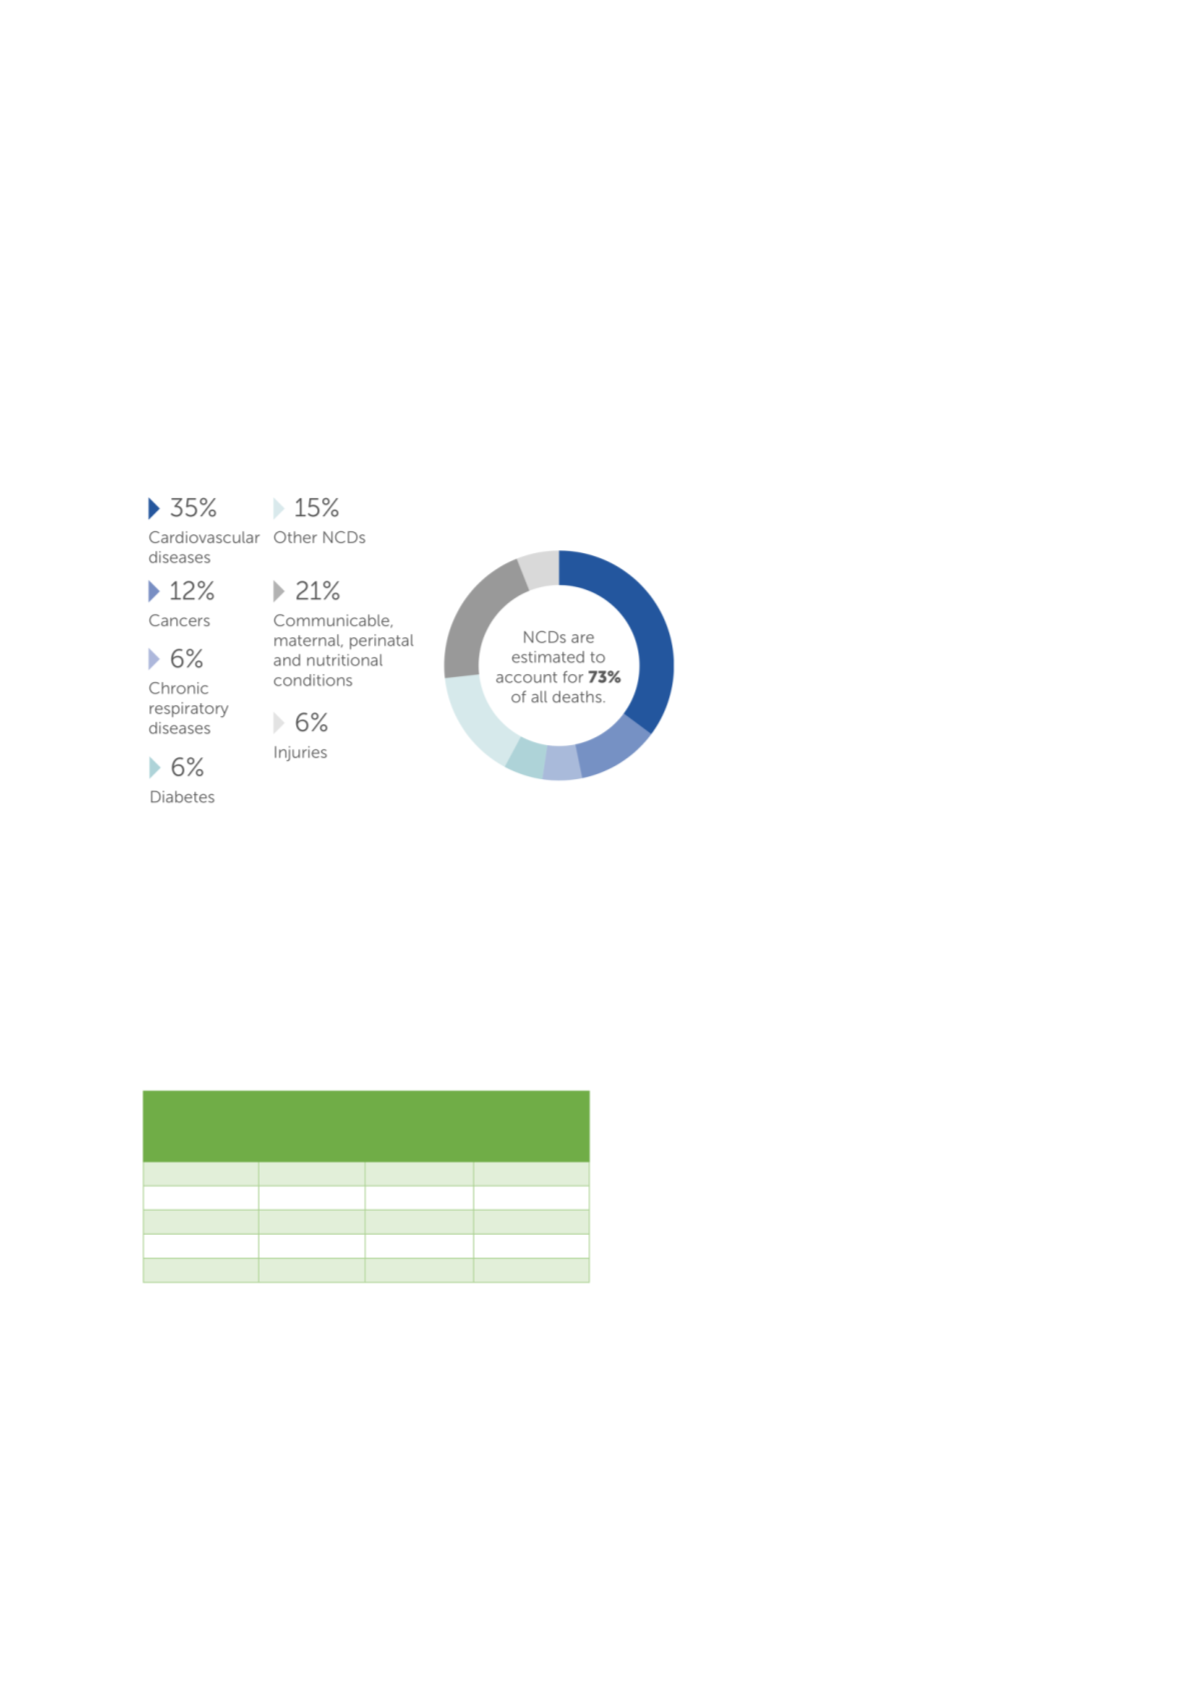
Figure 31presents the burden of specific diseases within the Indonesian population. As can be seen
the Indonesia health system faces a complex epidemiological challenge of high levels of both
communicable infectious diseases and persistent undernutrition and non-communicable diseases
(and here in particular cardiovascular diseases).
Figure 31: Proportional Mortality in Indonesia 2016
Source: WHO
Noncommunicable Diseases (NCD) Country Profiles, 2018
However, health status varies significantly across geographical locations with people living in Eastern
Indonesia and rural areas generally having worse health outcomes. For example, under-five mortality
is more than 2 times higher in the Eastern provinces of Maluku and Papua than in Java (73.8 vs. 34.8).
Similarly, rural households reporting an under-five mortality more than 50 per cent higher than in
urban households (calculations based on BPS, 2012).
Health outcomes also differ significantly by household wealth with people from the lowest quintiles
consistently having poorer health than
people from better off households
. Table 7 presents socio-economic differences in
child mortality indicators. The poorest
households are more than 3 times more
likely to experience the death of a child
below the age of 5 years than the
wealthiest households are.
Health outcome improvements and
differences reflect the development and
disparities of coverage of essential health
services across the country. Although coverage has improved considerable in Indonesia between
1990-2015 (Badan Pusat Statistik, 2012; WHO, 2017), considerable shortfalls in service coverage
remain in literally all public health areas (WHO, 2018). The health service coverage index in 2018 was
only 61 per cent in Indonesia which is far lower than expected based on the national income levels of
Indonesia (Hogan, Stevens et al. 2018). A recent study on magnitude and scope of inequalities in health
service access revealed major disparities in all essential health services across economic status,
education, occupation, age and place of residence – both provinces and rural/urban (WHO, 2017). For
Wealth
quintile
Neonatal
mortality
Infant
mortality
Under-
five
mortality
Lowest
29
52
70
Second
21
34
43
Middle
23
33
39
Fourth
15
28
34
Highest
10
17
23
Source: author’s own calculations based on (BPS 2012)
Table 7: Disparities in health outcomes by socio-economic
status