
79
In case of science performance in TIMSS, the situation is slightly better. Children from the top
two quintiles performed well in 1999 as well as in 2011 there is a clear decline in performance
across all wealth groups by 2011. As a matter of fact, in 2011, over 80% children from the top
two quintiles had attained basic science proficiency. In addition, children from the bottom
wealth quintile performed at the same level in 1999 and 2011 in terms of attaining the basic
proficiency threshold. These trends also held for intermediate (level 2) proficiency. However, in
case of advanced science proficiency, there is an across-wealth groups decline. The biggest fall
in attainment occurred among the top wealth quintile, from over 6% in 1999 to less than 4% in
2011 (
Figure 3.1.7
). In other words, Jordanian children continued to be poorly represented in
among advanced achievers in TIMSS regardless of the assessment round and wealth groups.
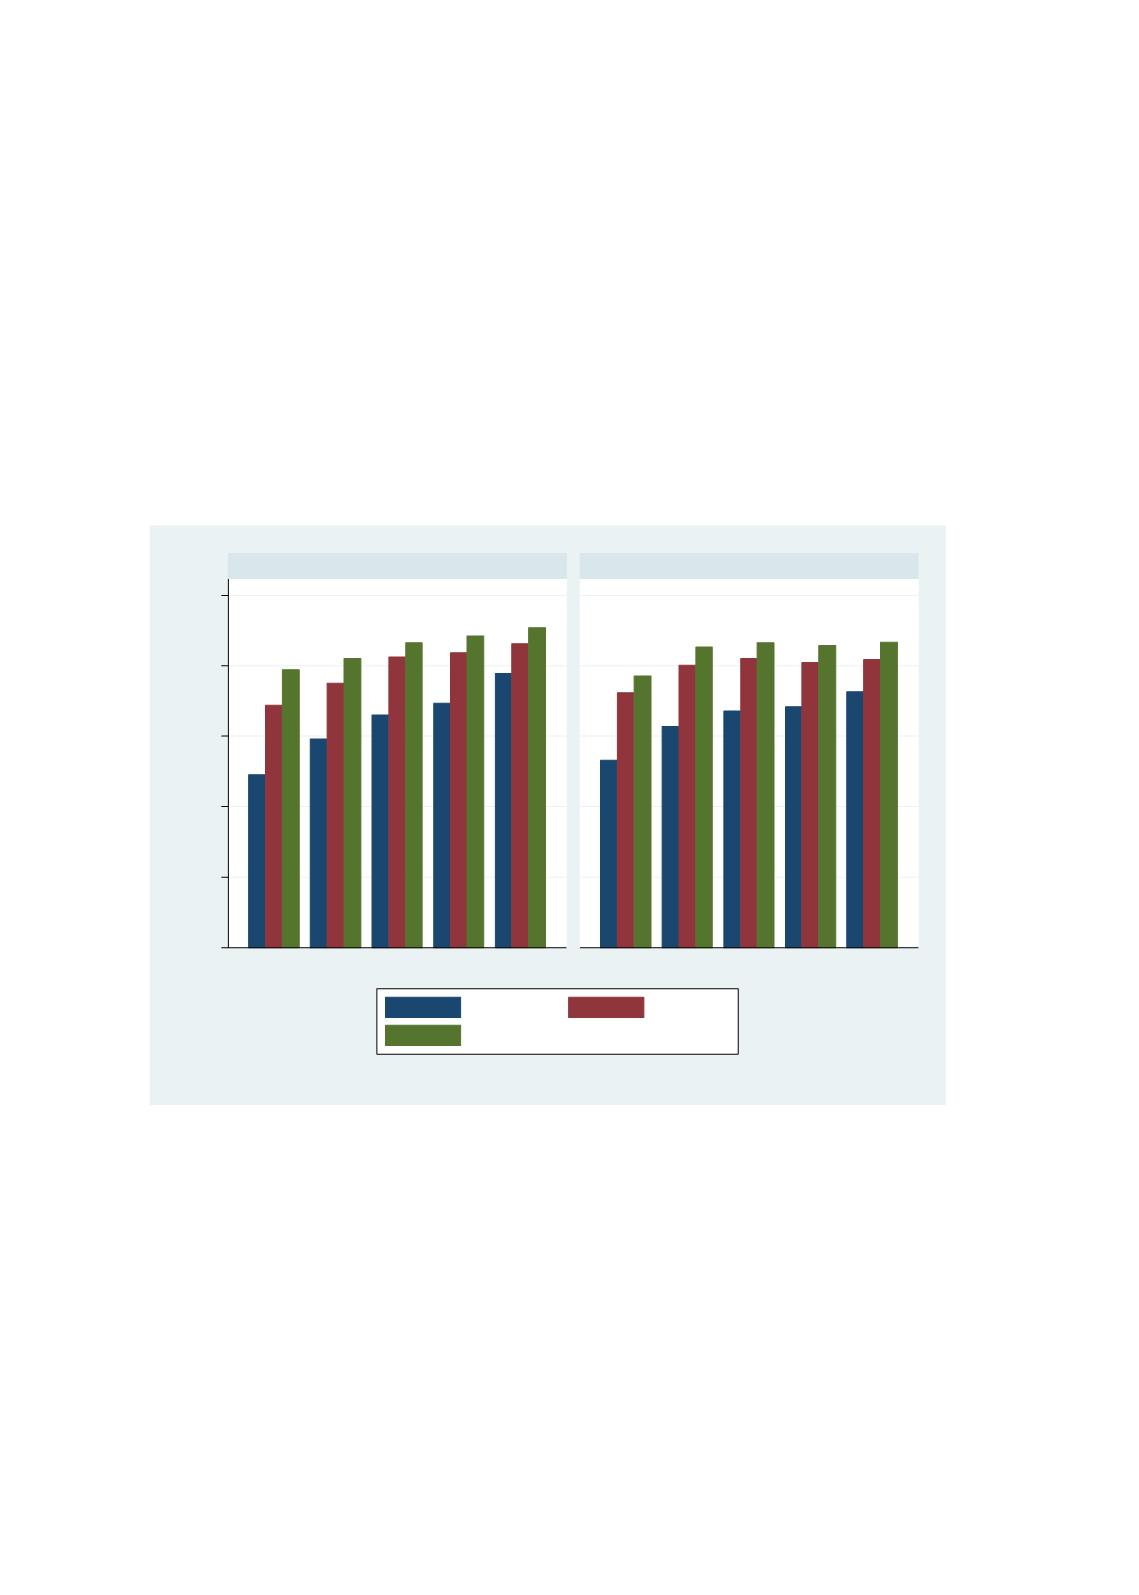
Figure 3.1.8: Trends in Level-1 Competency in Math, Reading and Science in PISA by Family
Wealth, 2009-2012 (Jordan)
Source:
Authors, based on WIDE database
In case of science performance in PISA, the situation is slightly better. In science and reading,
performance is stable across wealth quintiles between 2006 and 2011 in basic proficiency (level
1) (
Figure 3.1.8
). However, in math, there is a sharp decline in performance among children
from the poorest and richest wealth quintiles by 2011. The wealth gap is also the largest in case
of math and the smallest in science performance. In higher order competency (level 4), wealth
gap used to be very large in science (in 2006) (
Figure 3.1.9
). However, performance has
declined monotonically across all wealth groups in science and reading by 2012, narrowing the
wealth gap. Only in case of math, there is a slight improvement among children from top two
wealth quintiles in math in PISA 2012 round though this is unlikely to be statistically large.
0
.2
.4
.6
.8
1
1
2
3
4
5
1
2
3
4
5
Country Wealth Index Quintiles, 2006 Country Wealth Index Quintiles, 2012
Maths
Reading
Science
Graphs by category and year


