
76
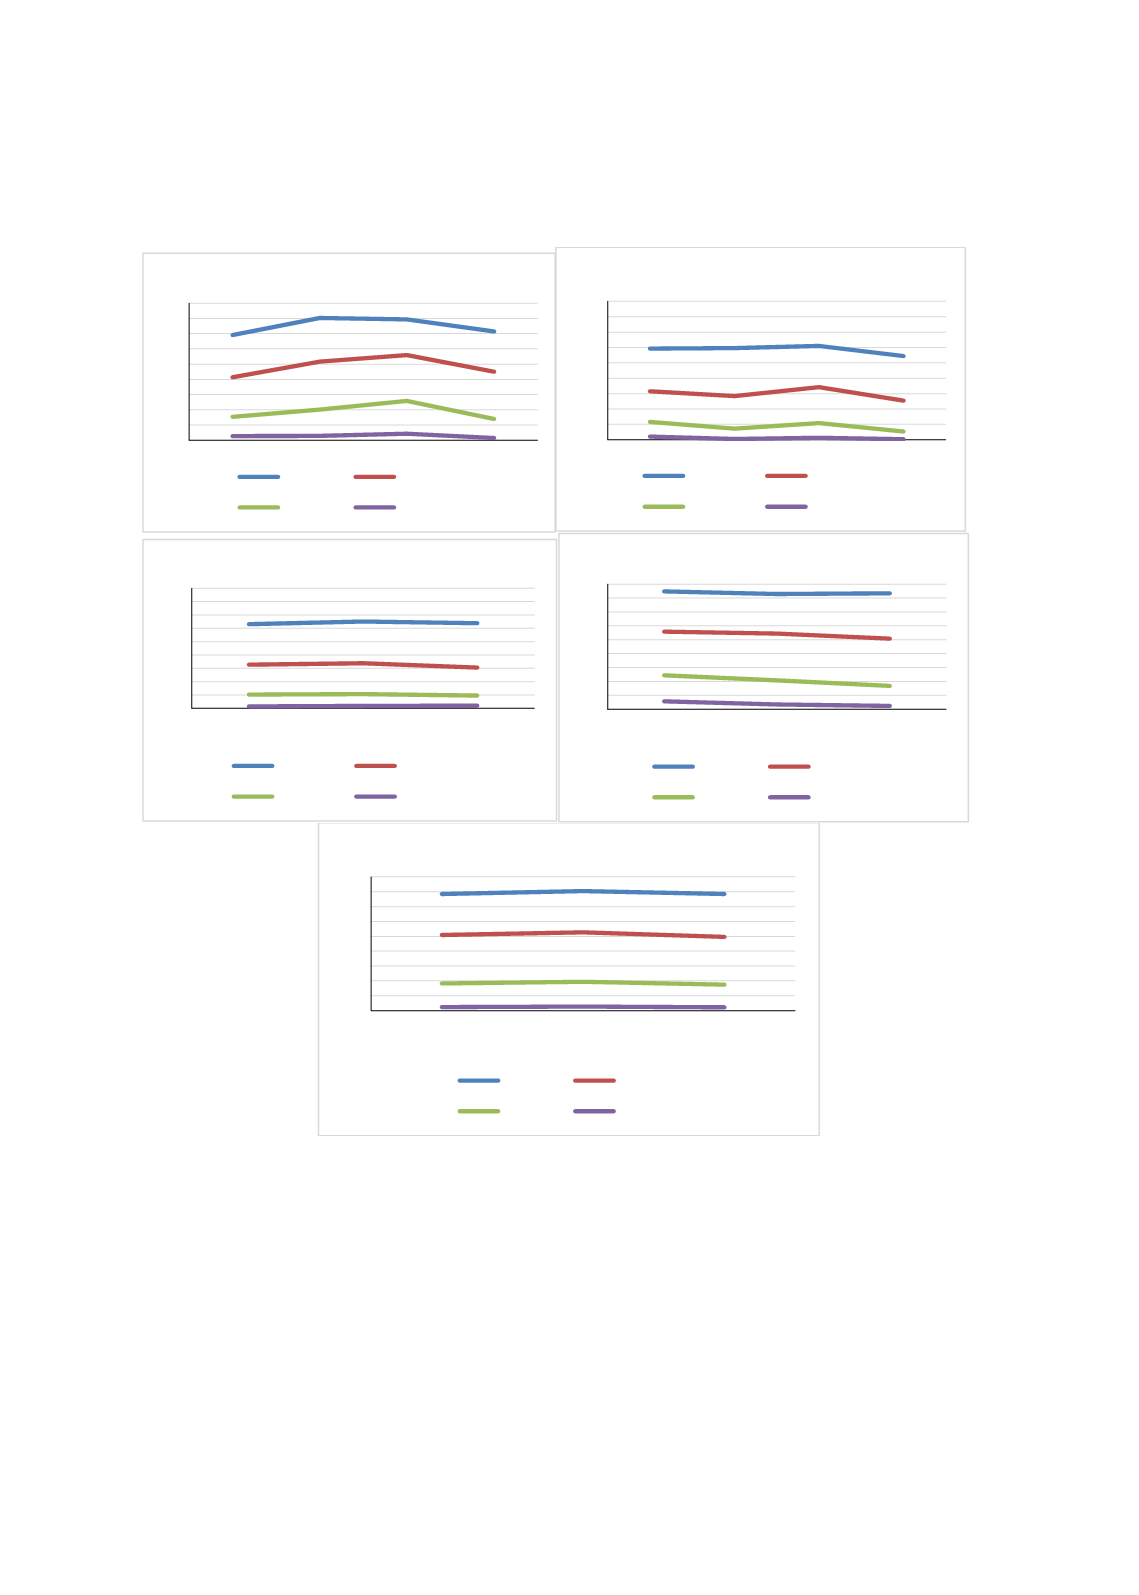
Figure 3.1.4: Trends in Subject-Specific Competencies in TIMSS and PISA, 1999-2012
(Jordan)
Source:
Author using WIDE database
To better understand the nature of learning shortfalls,
Figure 3.1.4
presents trends in student
performance by levels of proficiency in different subjects instead of the total scores. Only in case
of science performance in TIMSS, there is a steady rise in the proportion of children achieving a
specific proficiency level between 1999 and 2007. By 2011, however, there was a decline across
all proficiency level. In case of PISA, a monotonic decline is visible across all proficiency levels.
Figure 3.1.5
presents data on trends in Jordanian students’ performance in basic proficiency (in
terms of percentage of children attaining level-1 competency threshold) in Math and Science in
TIMSS by family wealth for the period 1999-2011. In mathematics, there is a clear decline in
performance across all wealth groups by 2011. This is a matter of concern considering the fact
0
0,1
0,2
0,3
0,4
0,5
0,6
0,7
0,8
0,9
1999
2003
2007
2011
Science scores in TIMSS
slevel1_m slevel2_m
slevel3_m slevel4_m
0
0,1
0,2
0,3
0,4
0,5
0,6
0,7
0,8
0,9
1999
2003
2007
2011
Math scores in TIMSS
mlevel1_m mlevel2_m
mlevel3_m mlevel4_m
0
0,1
0,2
0,3
0,4
0,5
0,6
0,7
0,8
0,9
2006
2009
2012
Math scores in PISA
mlevel1_m mlevel2_m
mlevel3_m mlevel4_m
0
0,1
0,2
0,3
0,4
0,5
0,6
0,7
0,8
0,9
2006
2009
2012
Science scores in PISA
slevel1_m slevel2_m
slevel3_m slevel4_m
0
0,1
0,2
0,3
0,4
0,5
0,6
0,7
0,8
0,9
2006
2009
2012
Reading scores in PISA
rlevel1_m rlevel2_m
rlevel3_m rlevel4_m


