
23
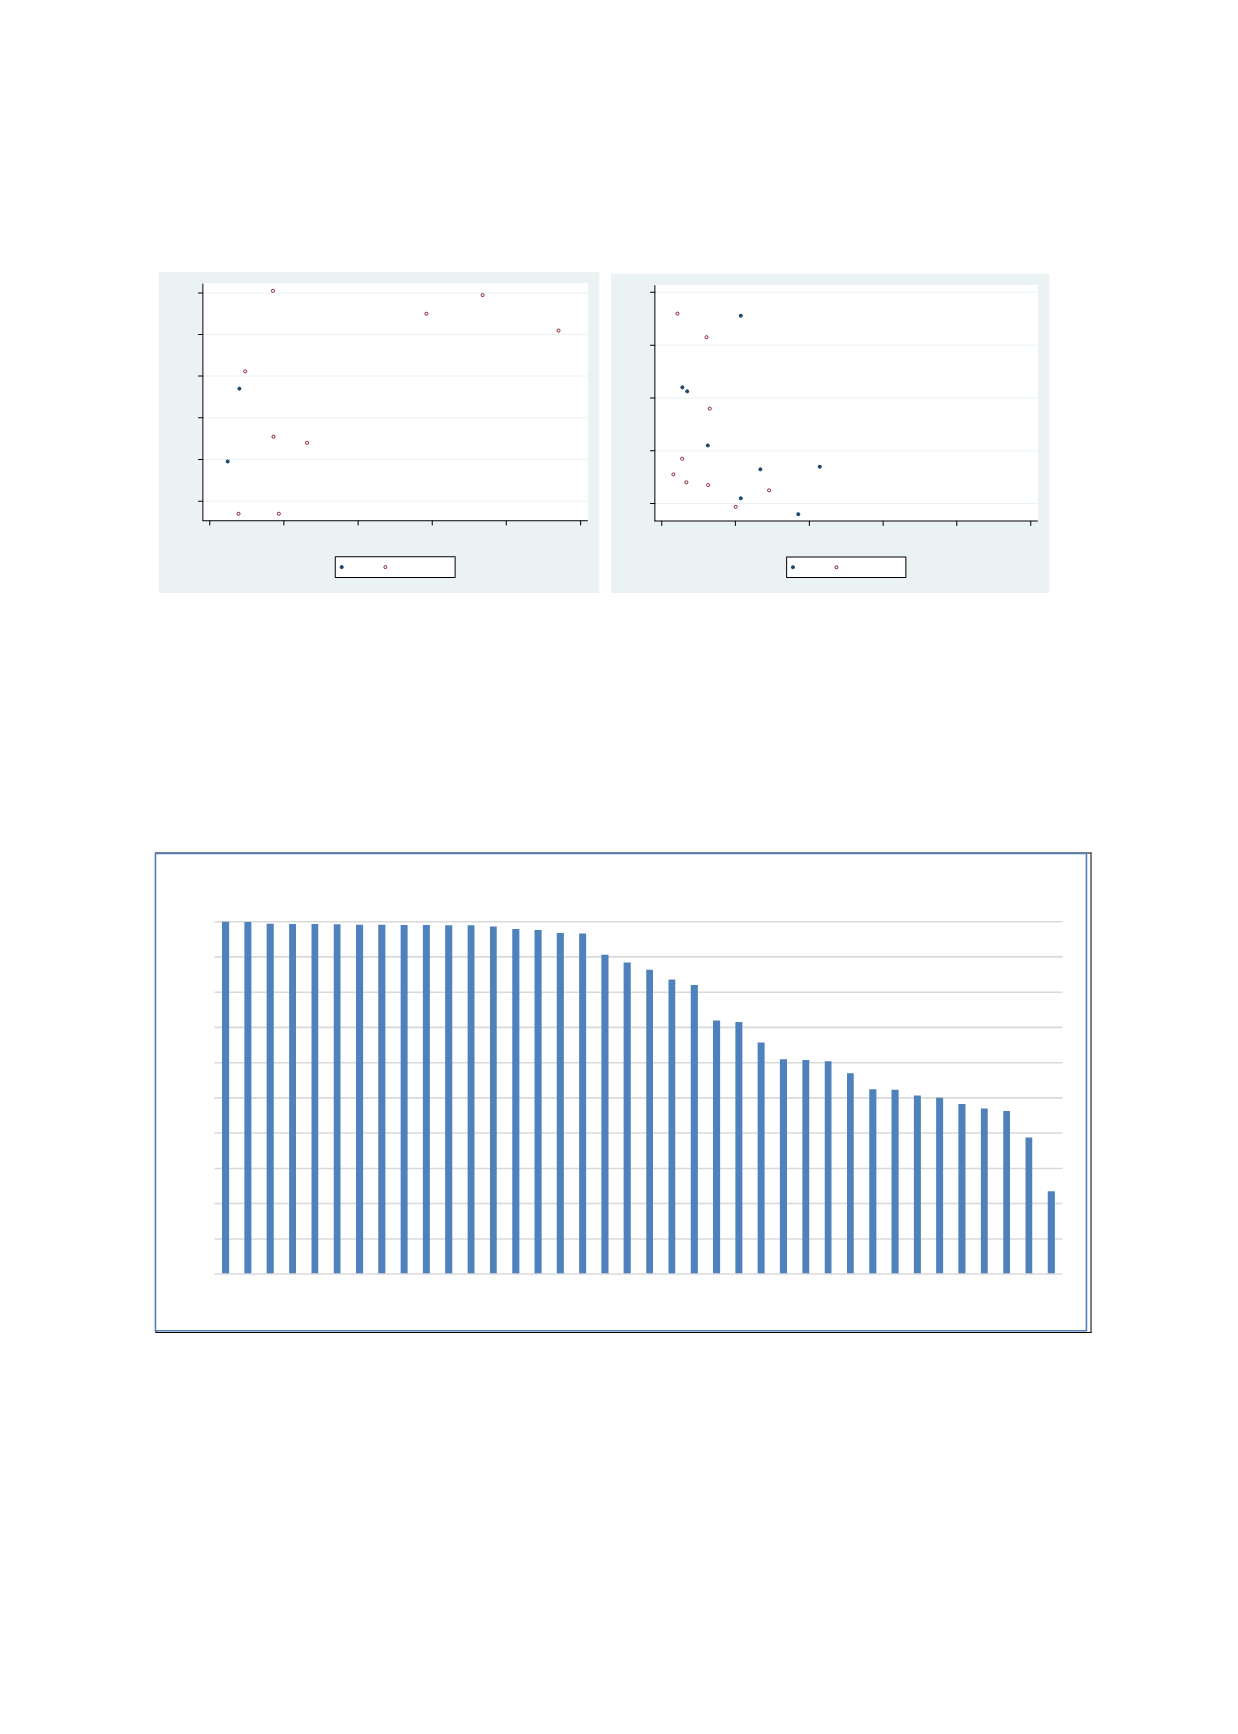
Figure 2.3: Readings Score in SACMEQ 2012 Figure 2.4: Readings Score in EGRA
Source: Authors’ calculations based on WIDE and the WDI data.
Another broad measure of the quality of educational output is youth literacy rate. Once again,
comparable assessment of literacy is unavailable for OIC countries. Therefore, self-reported
literacy data which is available for a wide range of OIC and other non-OIC countries has been
used.
Figure 2.5
presents the average data for youths for the period 2011-2015 against the
average per capita income of sample countries for the period 2006-2010).
Figure 2.5: Youth Literacy Data
MOZ
UGA
500 520 540 560 580 600
0
1000
2000
3000
4000
5000
GDP per capita, 1996-2000
OIC NON-OECD
IRQ
JOR
MAR
MLI
NGA
PSE
UGA
YEM
.2
.4
.6
.8
1
% students with 0 score in EGRA
0
2000
4000
6000
8000
10000
GDP per capita, 2006-2010
OIC NON-OECD
0
10
20
30
40
50
60
70
80
90
100
UZB
AZE
IDN
BRN
PSE
MDV
SAU
TUR
JOR
OMN
KWT
ALB
QAT
IRN
SUR
TUN
GUY
EGY
GAB
MAR
UGA
TGO
PAK
COM
BGD
SEN
GMB
GNB
SLE
BEN
IRQ
CIV
BFA
MLI
AFG
GIN
TCD
NER
Youth literacy rate in OIC countries, 2011-15


