
21
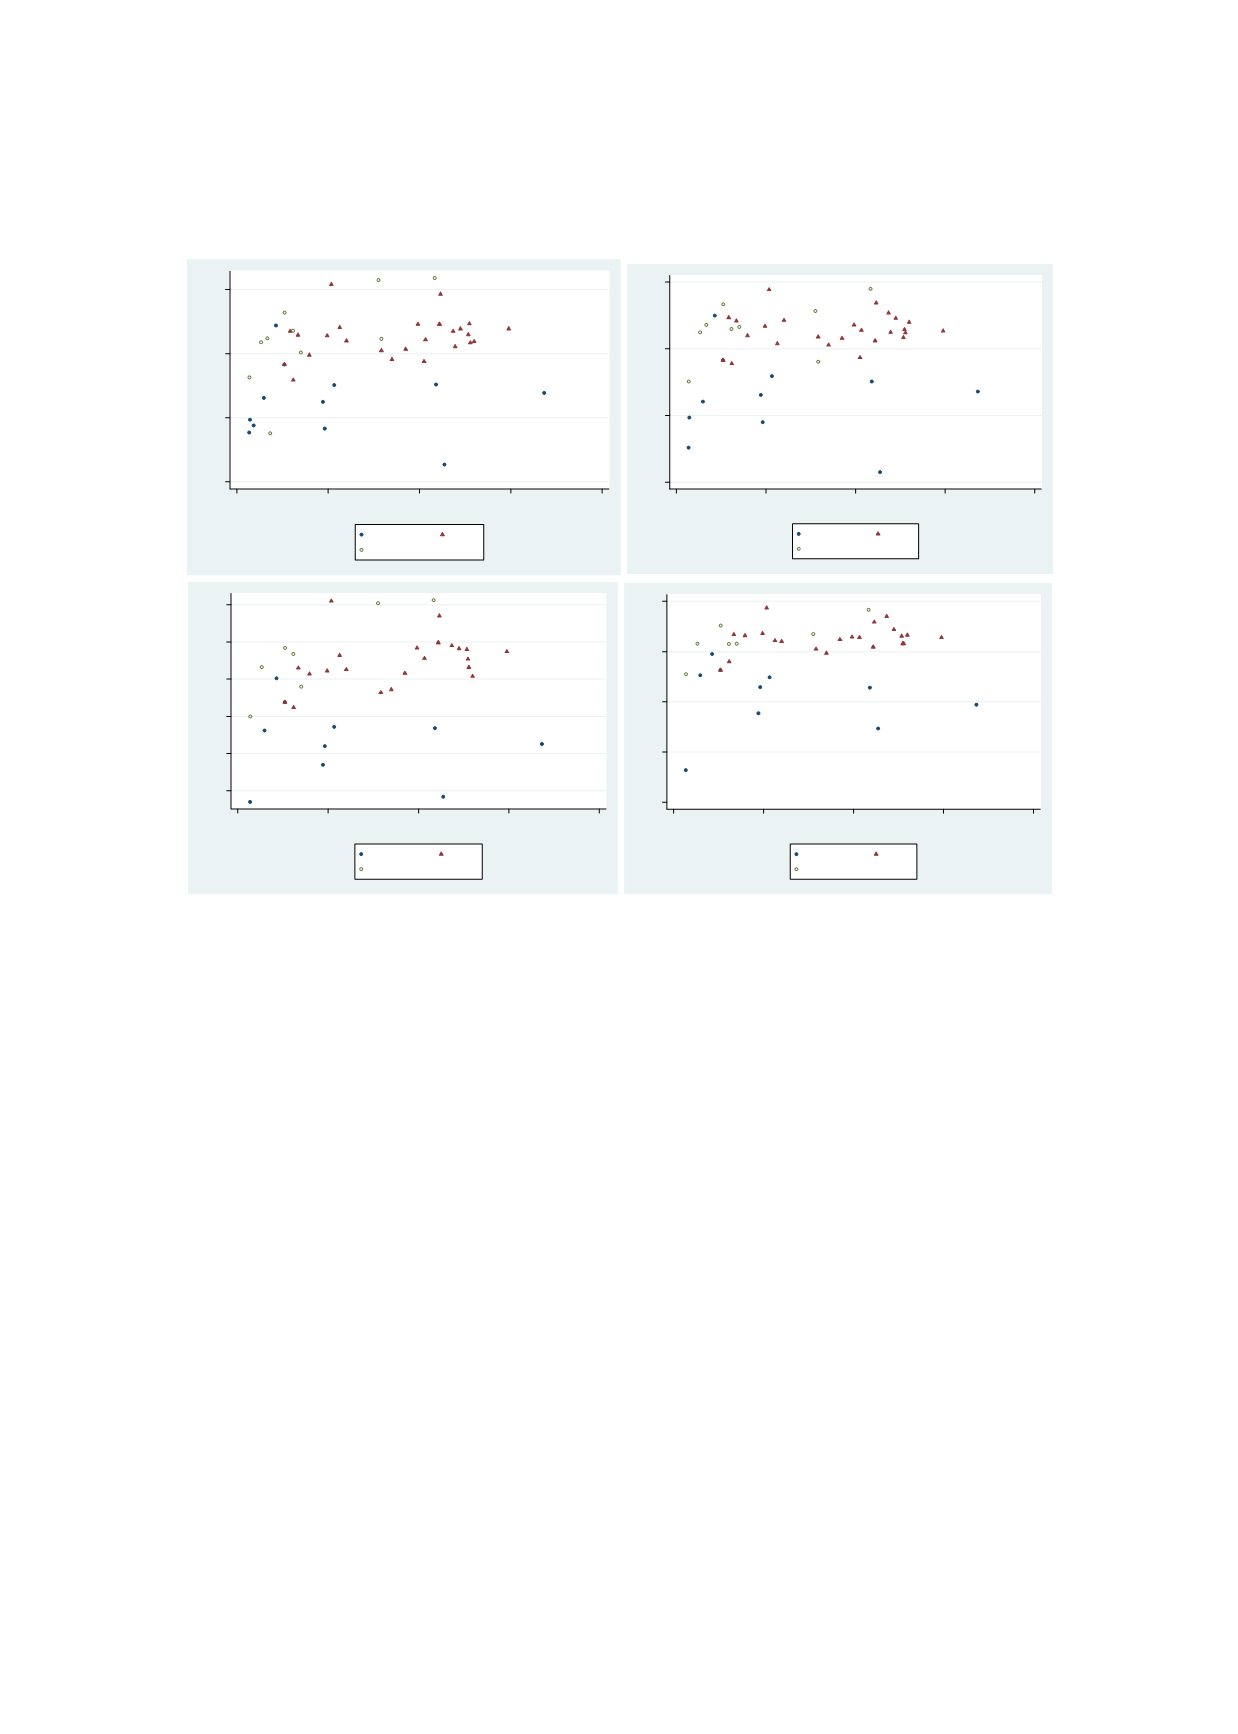
Figure 2.1: Average Math and Science Score in TIMSS
Source: Authors’ calculations based on WIDE and the WDI data.
Figure 2.2
presents country level PISA and PIRLS scores by per capita GDP. Students from
Kazakhstan and Turkey perform favorably with respect to the OECD average despite their much
lower income relative to OECD countries. In the OECD sample, the average PISA score for each
subject is about 490 points. Scoring 30 points above that is roughly equivalent to completing an
extra year of schooling. Using that yardstick, children in Qatar are several years of schooling
behind their counterparts in the OECD in science, reading and mathematics.
ARE
BHR
IDN
IRN
JOR
KAZ
KWT
MAR
OMN
QAT
SAU
TUR
300
400
500
600
Maths score in TIMSS, 2015
0
20000
40000
60000
80000
GDP per capita, 2006-2010
OIC
OECD
NON-OECD
ARE
BHR
IDN
IRN
KAZ
KWT
MAR
OMN
QAT
SAU
TUR
300
400
500
600
Science score in TIMSS, 2015
0
20000
40000
60000
80000
GDP per capita, 2006-2010
OIC
OECD
NON-OECD
ARE
BHR
IRN
KAZ
KWT
MAR
OMN
QAT
SAU
TUR
350 400 450 500 550 600
Maths score in TIMSS, 2011
0
20000
40000
60000
80000
GDP per capita, 2006-2010
OIC
OECD
NON-OECD
ARE
BHR
IRN
KAZ
KWT
MAR
OMN
QAT
SAU
TUR
200
300
400
500
600
Science score in TIMSS, 2011
0
20000
40000
60000
80000
GDP per capita, 2006-2010
OIC
OECD
NON-OECD


