
175
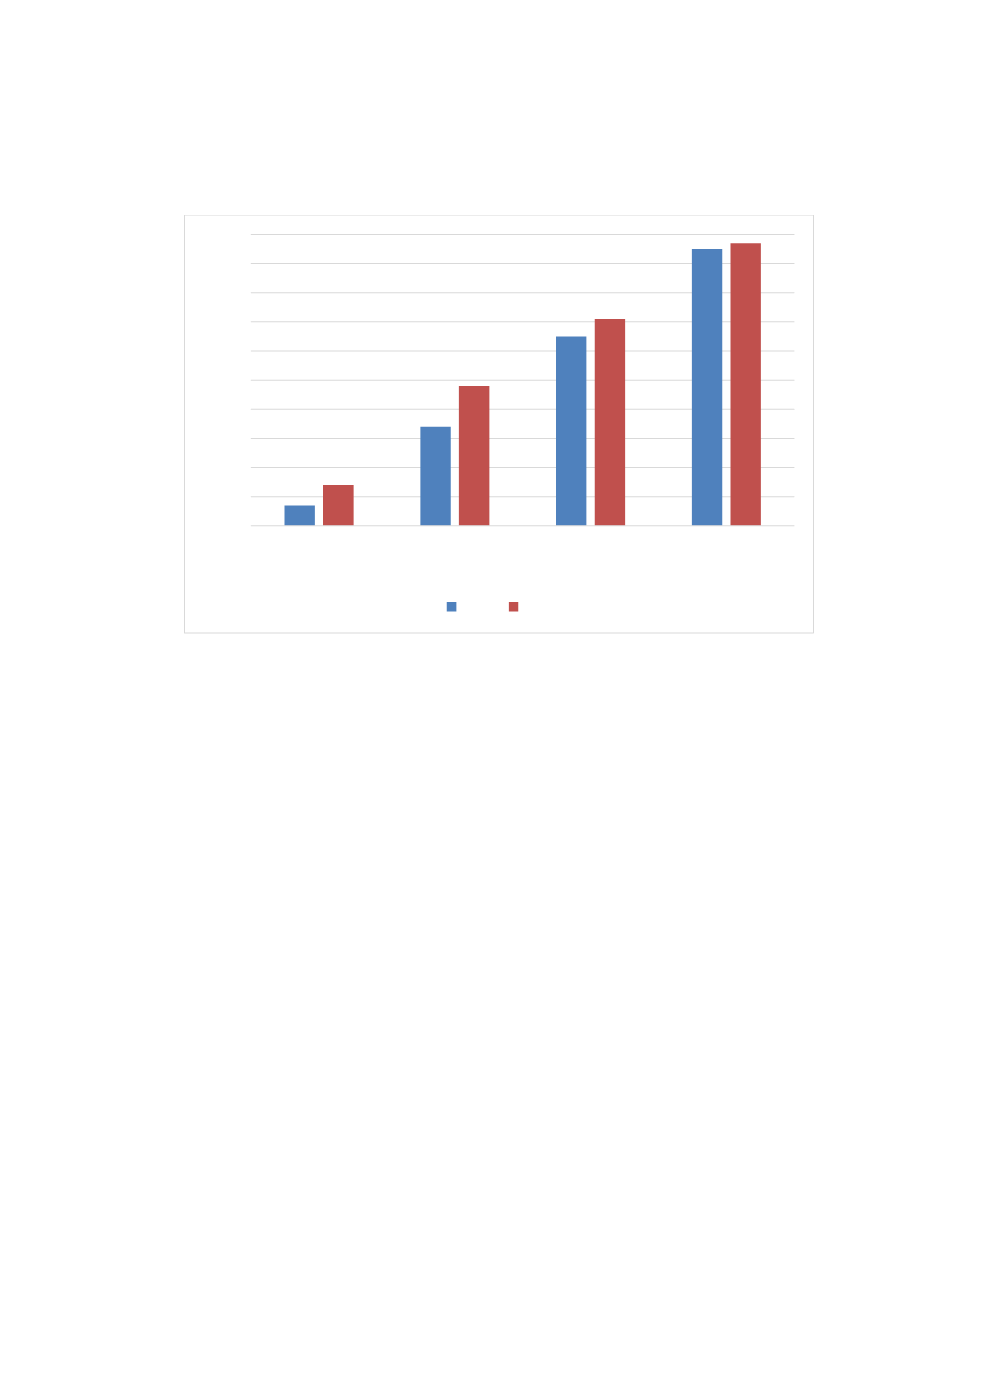
Figure 3.4.8: Children’s Numeracy Skill by Mother's Schooling
Source:
Authors; Data is fromNPC & RTI, 2016
In the 2015 NEDS, literacy rate in the urban areas (67.7%) was better than that of the rural areas
(34.8%). Across the zones and states, all the southern zones had more than 50% literacy rates
with Lagos having up to 89% literacy rates while all the northern zones had lower than 50%
literacy rates, which stood as low as 17% in Jigawa state in the northwest.
Similar trend is observable in the 2010 NEDS data which shows that among children age 5–16,
literacy rates varied greatly across the states. More children were not able to read in the north
than in the south. More than 75% of the children in 10 out of the 19 northern states were not
able to read. In all the southern states, only Ebonyi state had literacy rate below 50%, which was
49%. In all the northern zones, Only Federal Capital Territory (66%), Kogi (52) Kwara (53) and
Plateau (53) all of which are in north-central zone had literacy rate above 50%, the rest of the
northern states are below 50%. Bauchi and Sokoto states had 92% and 91% respectively of
children age 5–16 that were unable to read while Lagos and Ekiti in the southwest had 92% and
85% respectively were able to read. It is noteworthy that unlike in the previous sections states
data are presented within the zones to highlight actual states where critical attentions are
needed (NPC & RTI, 2011).
From the 2015 NEDS, it is observed that numeracy rate was almost twice higher in the urban
(75.6%) than in the rural areas (39.6%). Across the zones, while the lowest rate in the south was
74.4% (southeast), the highest in the northern zones was 53.6% (north-central). Across the
states, the lowest rate in the southern states was found in Cross Rivers (49.1%), the rest of the
southern states had above 70% numeracy rates. In the north, no state in the northeast and
northwest had up to 50% numeracy rate; the Federal Capital Territory had 82.9%; Benue, Niger
and Plateau states did not record up to 50% numeracy rates (NPC & RTI, 2015).
0%
10%
20%
30%
40%
50%
60%
70%
80%
90%
100%
No Schooling
Pre-primary
Primary
Secondary and
Higher
2015 2010


