


 186 / 253

174
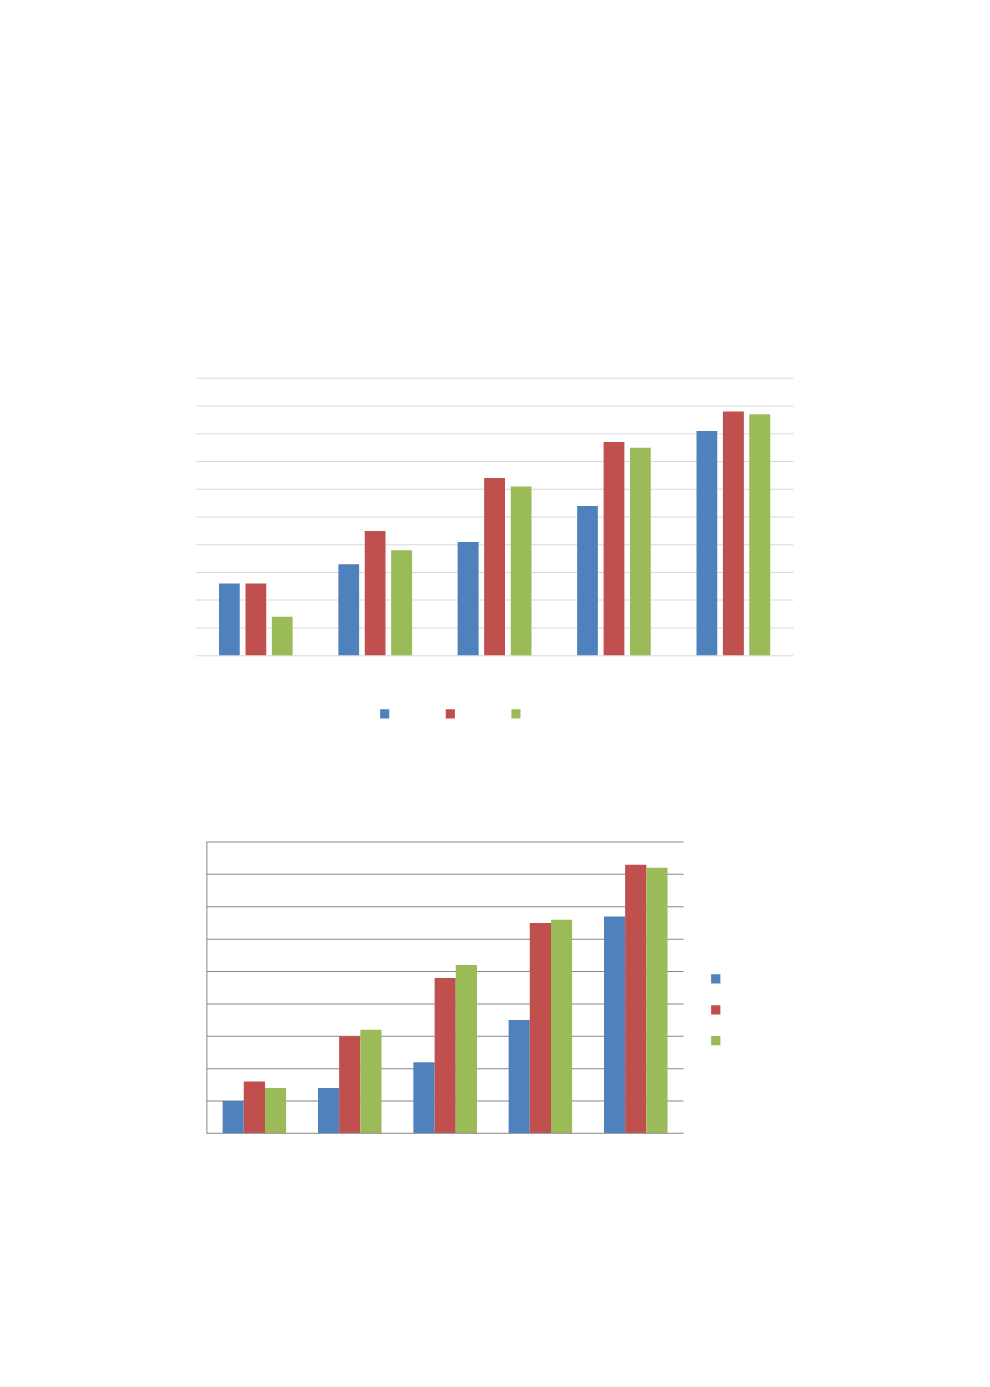
numeracy rate. The rates fluctuated across different economic quintiles between 2004 and 2015
for children between the ages of 5 and 16. It is not clear the reason for this but a consistent
correlation between economic quintiles and numeracy rates is observable from the data (NPC &
RTI, 2016). Also, there appears to be a correlation between mothers' levels of education and
children's performance in arithmetic. As summarised in
Figure 3.4.8
, children whose mothers
had no education had 7% numeracy rate while those whose mothers had primary and minimum
of secondary education had 65% and 95% rates respectively (NPC & RTI, 2016).
Figure 3.4.6: Children’s Numeracy Skill by Household Wealth
Source:
NPC & RTI, 2016
Figure 3.4.7: Children's Literacy Skills by Household Wealth (Children Ages 5-16 Able To
Read)
Source:
NPC & RTI, 2016
0%
10%
20%
30%
40%
50%
60%
70%
80%
90%
100%
bottom quintile 2nd quintile 3rd quintile 4th quintile top quintile
2004 2010 2015
0%
10%
20%
30%
40%
50%
60%
70%
80%
90%
bottom
quintile
2nd quintile 3rd quintile 4th quintile top quintile
2004
2010
2015