


 185 / 253

173
At the primary six level, information is available for two different tests, 2003 and 2011, and also
suggest similar trend observed in the primary four level test. The MLA, as summarized in
Figure
3.4.4
indicates that the overall national mean percentage scores was 41.45 in 2003 and declined
to 39.50 in 2011 in the literacy test. In numeracy test, it national score declined from 35.73 to
31.19.The decline is also observed across public and private and. Urban and rural areas.
The NEDS (2015) data considered children that could read at least one of three words presented
on a flashcard in English literate. Also, those that could read any of the three National languages
on a presented on a flashcard were considered literate. Despite the formal reduction of quality
standards through a lowering of the literacy criteria, NEDS data also shows a decline learners’
achievement between 2010 and 2015. The achievement also varied according to households’
backgrounds. Children from poorest households achieved the lowest rate (10% in 2004, 16% in
2010 and 14% in 2015) while children from the richest households got highest rates (67% in
2004, 83% in 2010 and 82% in 2015). Similar trends are also observed at the JSS level (NPC &
RTI, 2016).
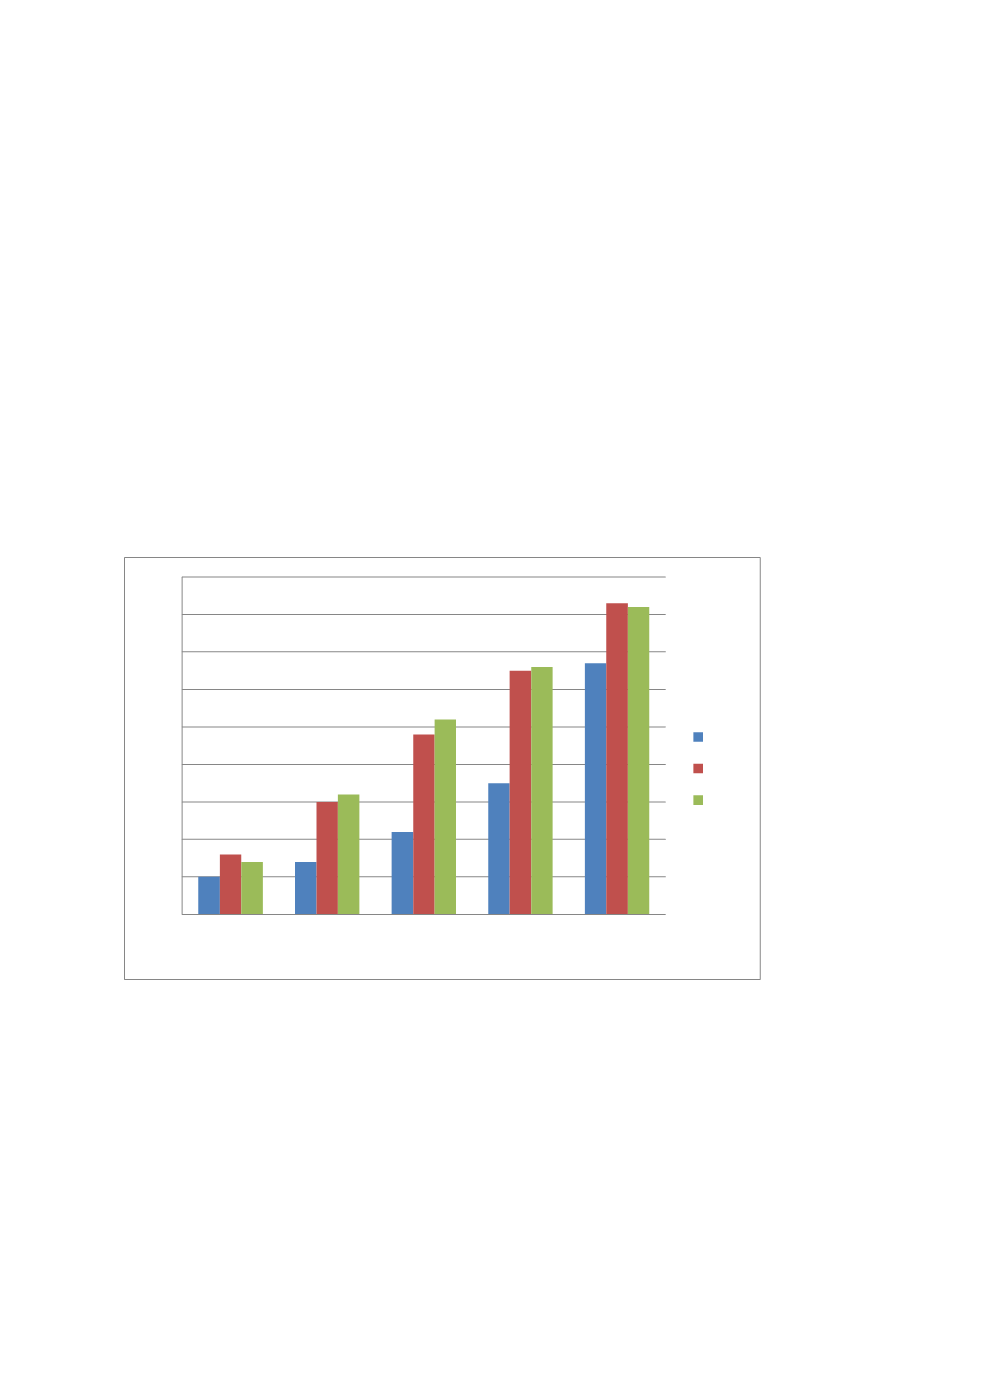
Figure 3.4.5: Children's Numeracy Skills by Household Wealth (Children Ages 5-16 Able To
Read)
Source:
NPC & RTI, 2016
2015 NEDS reveals the noticeable difference between private and public schools. At the primary
level, private schools literacy rate stood at 74% while public schools rate was 44%. A similar
trend is also observed at the JSS level where private schools rate stood at 96% while the public
school rate was 91%. In Numeracy, public schools' rate at both primary and JSS levels were 56%
and 94% respectively while the private school rates were 84% and 95% respectively.
According to the 2015 NEDS data, a wide gap existed in primary school numeracy between pupils
from poorest households (14% in 2015) and those from the richest households (87% in 2015).
Figure 3.4.5
shows that the higher a households' economic status the higher their children's
0%
10%
20%
30%
40%
50%
60%
70%
80%
90%
bottom
quintile
2nd quintile 3rd quintile 4th quintile top quintile
2004
2010
2015