


 93 / 277

Education of Disadvantaged Children in OIC:
The Key to Escape from Poverty
83
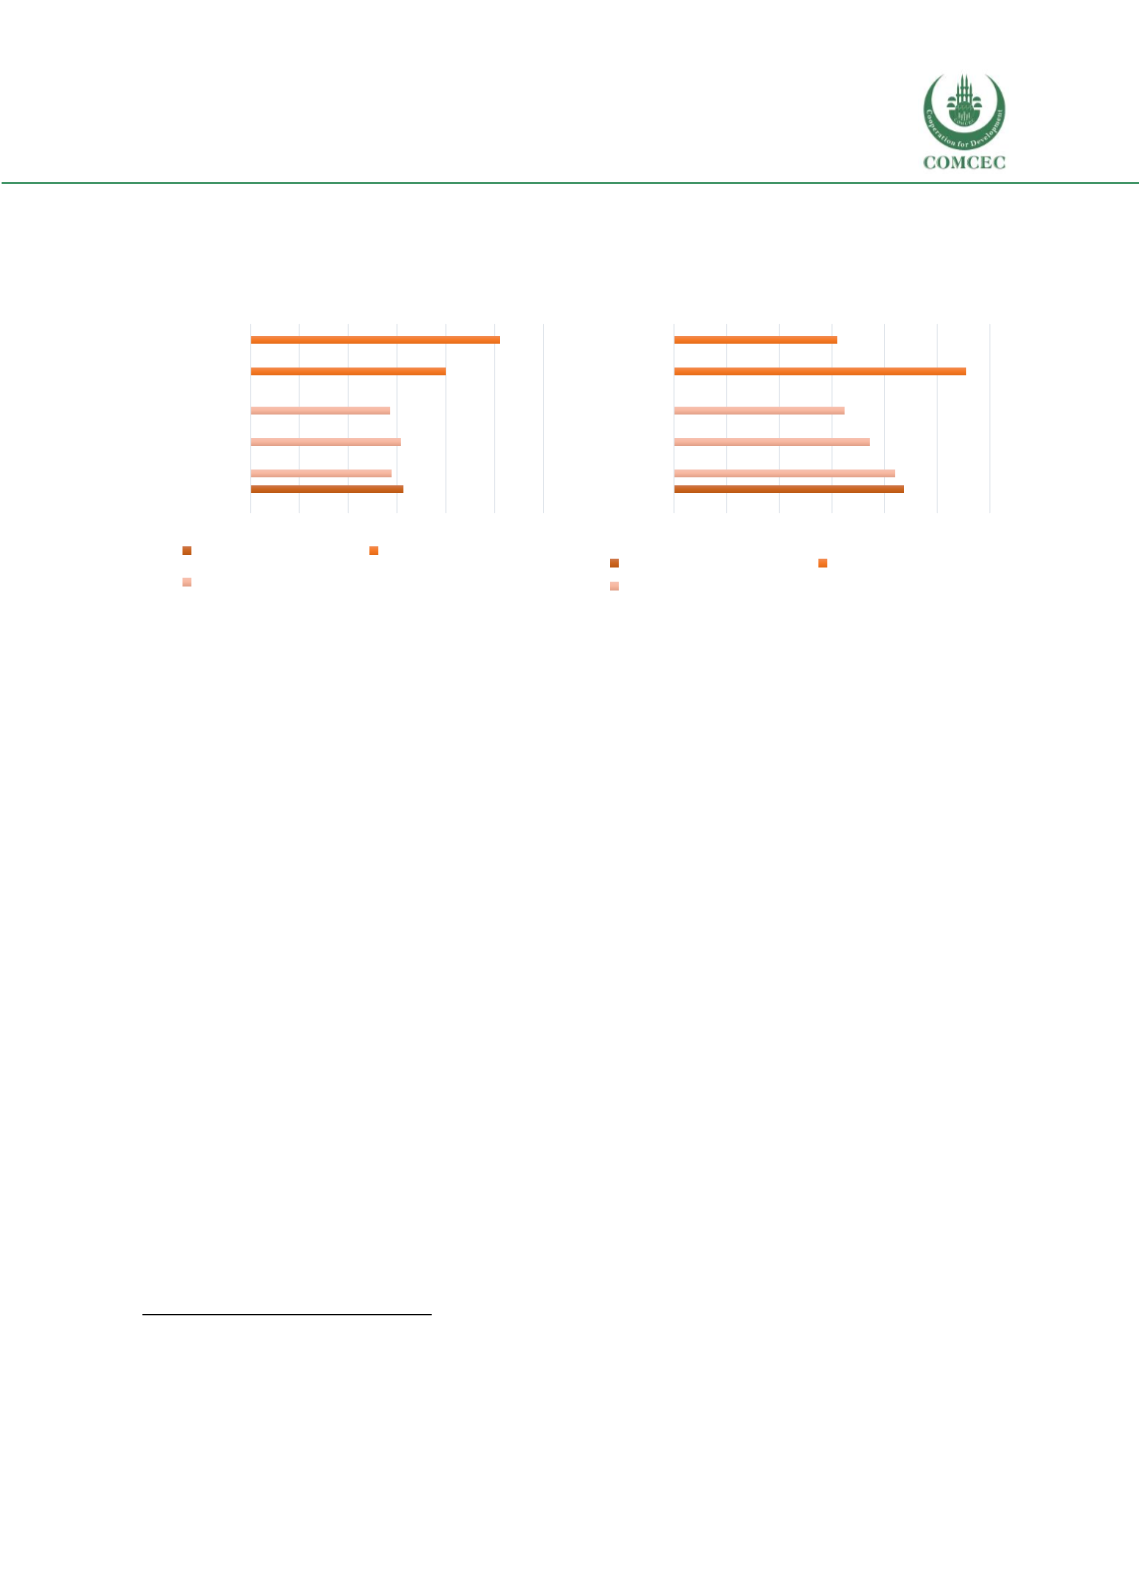
Figure 32 Percentage of students going to preschool
A.
Students at the beginning of the
primary cycle
B.
Students at the end of the primary cycle
Note: CONFEMEN (2014)
Education Financing
High investments:
In terms of resource allocation, Senegal has shown a strong commitment to
education historically, including primary education. Senegal allocates a large share of its budget
to education, one of the largest shares of any OIC countries (See Figure 14, Chapter 2). Currently,
the authorities allocate about 24.8% of the total domestic resources to education, equating to
about 7.2% of GDP in 2014.
Composition of spending:
However, a very large portion of that spending goes toward recurrent
expenditures
239
(especially teacher salaries). A UNICEF (2016) report shows that between 2006
and 2013, recurrent expenditure average around 90% with only 10% left for capital
expenditures
240
. This modest share of resources allocated for capital expenditures leads to
financing shortages for purchasing of instructional material and other inputs affecting the quality
of education.
Dividing the education spending into howmuch is spent on access, quality and management leads
to another striking feature: over the past few years, around 80% of primary school spending and
90% of secondary school spending went into budgets pertaining to ‘access’
241
. Only 20% of
primary level spending and 10% of secondary spending is for ‘quality’ and ‘management’. Such
spending did translate into higher education access rates as seen in the earlier section but the
quality of schooling has lagged behind and reflects its low investment levels.
239
UNICEF (2016) “Analyse des depenses publiques dans les secteurs sociaux au Senegal 2006-2013”
240
UNICEF (2016) figure 12
241
UNICEF (2016) figure 14
31,3
51,1
40
28,6
30,8
28,9
0 10 20 30 40 50 60
North
West
Center
Southeast
Southwest
National
Reference area
significant difference
Non-significant difference
43,7
31
55,5
32,4
37,2
42
0 10 20 30 40 50 60
North
West
Center
Southeast
Southwest
National
Reference area
significant difference
Non-significant difference