


 175 / 277

Education of Disadvantaged Children in OIC:
The Key to Escape from Poverty
165
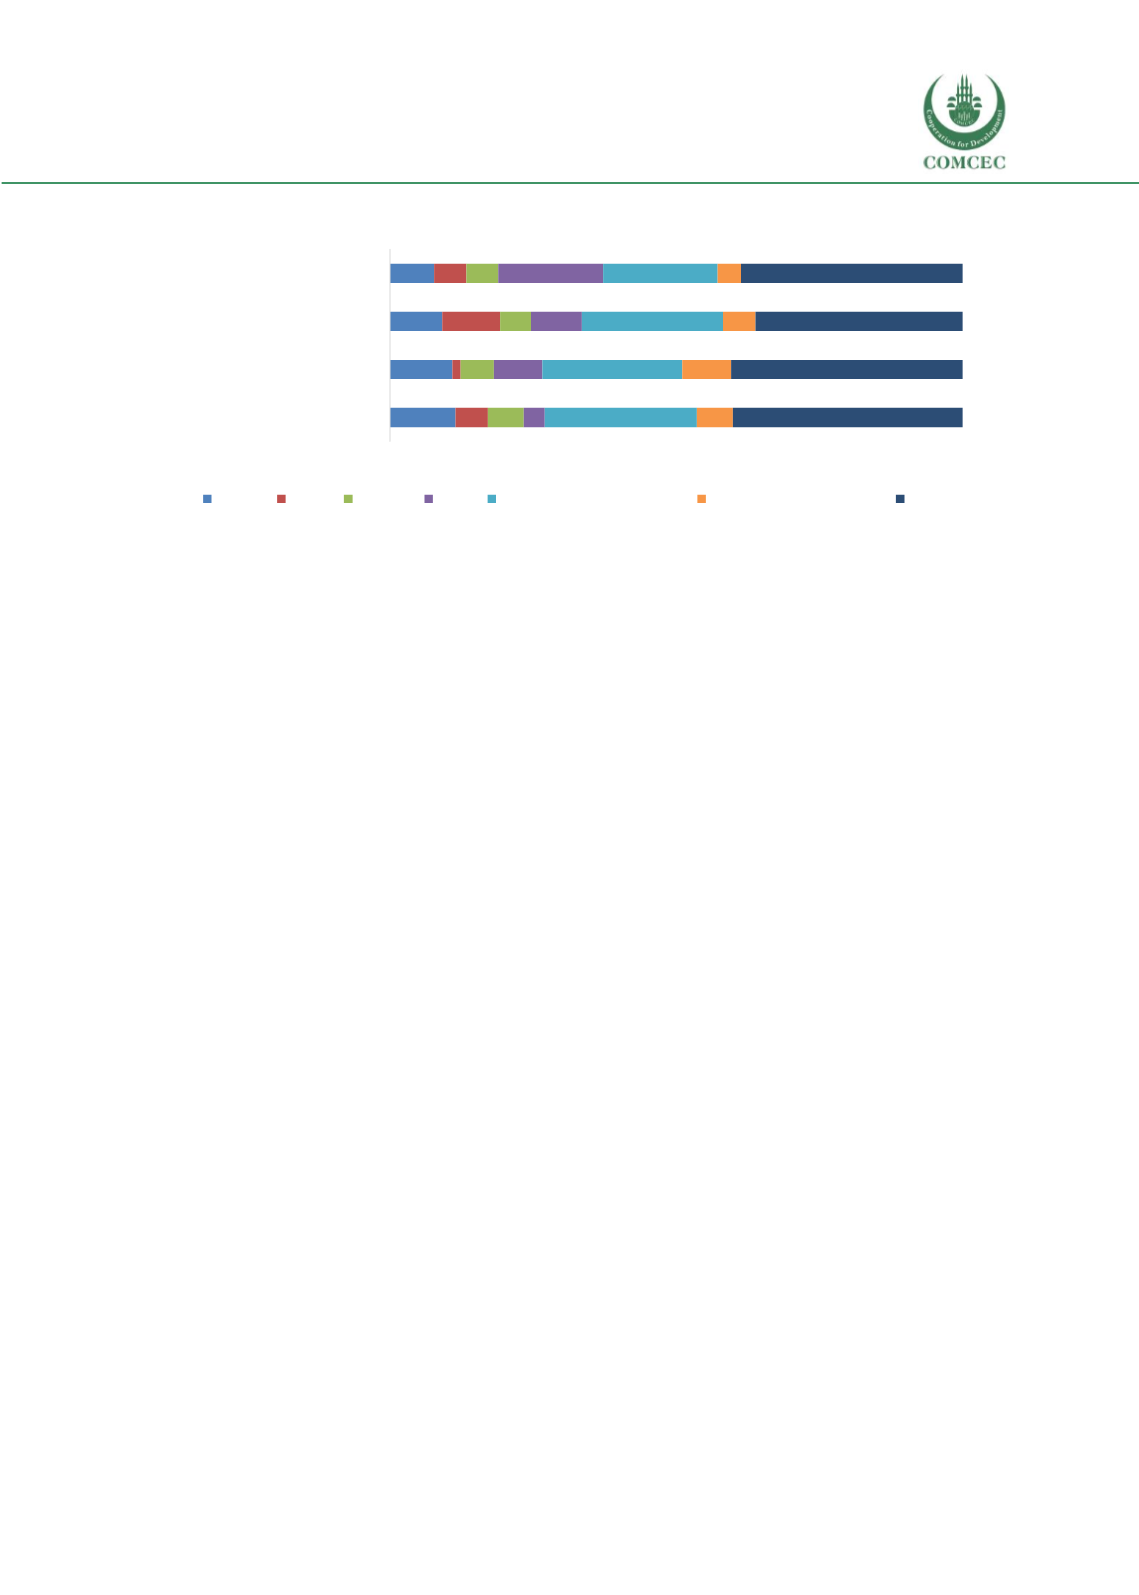
Figure 60 Shapley decomposition for 2012
Source: Authors’ calculations using DHS 2012
Householdwealth contributes themost to inequality and it is followed by household head’s
education (Se
e Figure 60).
The Shapley decomposition results show that for Pakistan in 2012,
wealth is the factor that contributes the most to inequality of opportunity for all four education
indicators. More than or close to 40 percent of inequality in the education indicators can be
explained by household wealth. Taken together household wealth and household head’s
education explain between 58.7 and 66.7 percent of inequality for all four indicators. Other
circumstances all contribute less to inequality compared to wealth and household head’s
education.
These findings are in line with the ones in section 2.2 where poverty and low household education
level are linked to low access levels. Wealth is highly correlated with the household head’s
education level and as such poverty can be seen as the largest barrier/circumstance that prevents
access to education in Pakistan.
Probit regression results
Regression results show that circumstances continue to have a large impact on education
indicators of children.
Wealth has the largest impact and there has been no or little progress, in
some cases even deterioration, in access to school for the poorest. In contrast, while gender
remains an important circumstance for education opportunities, Pakistan seems to have been
relatively successful in tackling the disadvantaged situation of girls in access to education.
Urban/Rural:
Regression results show that living in rural areas does not have any large marginal
effect on education indicators in Pakistan. This finding is in line with the Shapley decomposition
results but in contrast with the correlation analysis, which found much lower access rates in rural
areas compared to urban ones.
Geography/Region:
The likelihood of attendance or finishing education in 2012 is significantly
decreased when living in certain regions such as Sindh or Balochistan. Living in those regions
affect the education opportunities most negatively.
11,5
10,9
9,2
7,7
5,7
1,4
10,1
5,6
6,3
5,8
5,4
5,6
3,7
8,5
8,9
18,3
26,6
24,4
24,6
20,0
6,2
8,5
5,7
4,1
40,1
40,4
36,2
38,7
0 10 20 30 40 50 60 70 80 90 100
Finishing 8 years of education
Finishing 5 years of education
Attendance 12-15 year olds
Attendance 6-11 year olds
location gender language region household head's education # of children in household wealth