


 163 / 277

Education of Disadvantaged Children in OIC:
The Key to Escape from Poverty
153
3.4 PAKISTAN
Overview
Country Context
Economy, Security, Disasters:
Pakistan is a developing country with a nominal GDP per capita of $1,428 and so ranks 147
th
in
the world as of 2016. The country’s economy is semi-industrialised, with a large informal sector
estimated at 36% of the overall economy, and has been transforming from a predominantly
agricultural to an industrial and service based economy over the past 20 years. Its growth poles
are situated along the Indus River and the major urban centres in Punjab, its richest province.
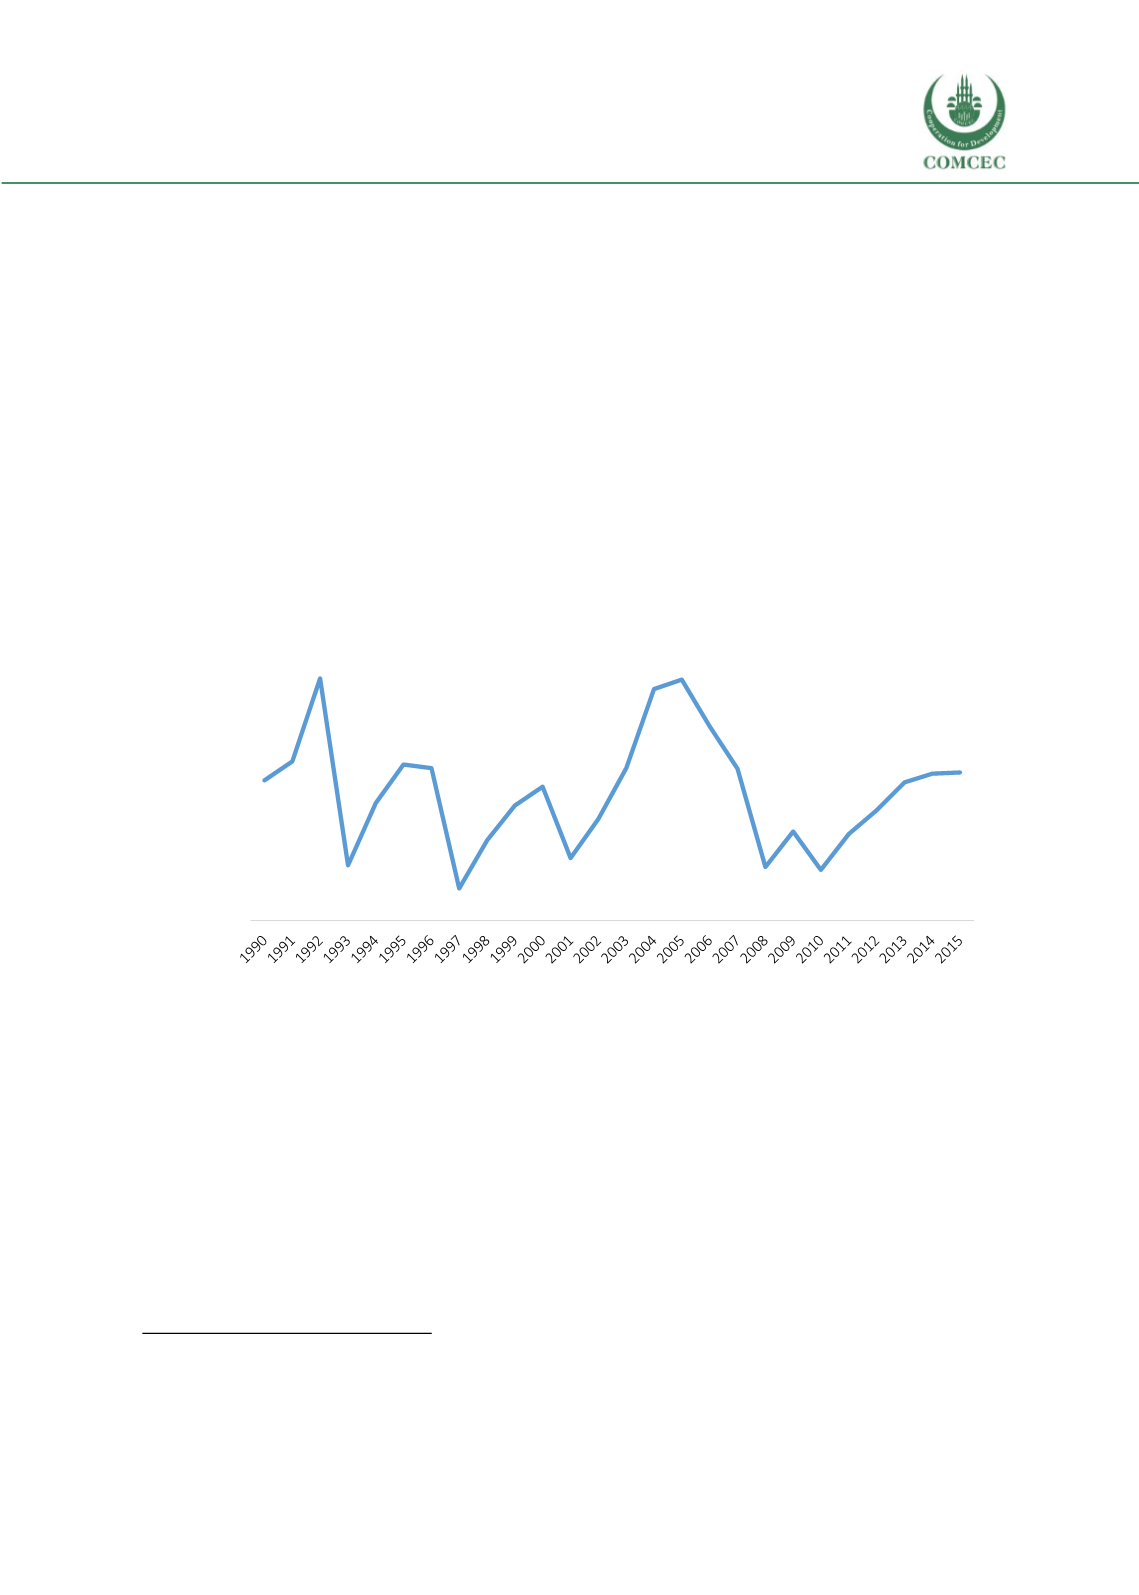
GDP
growth rates have been volatile over the past 20 years as the country suffered from tense regional
political relations, a fast-growing population, mixed levels of foreign investments and several
disasters (Se
e Figure 55 ).
Figure 55 GDP growth rate from 1990 to 2015
Source: World Bank World Development Indicators
With a population of around 190 million (the world’s 6
th
largest),
the number of people affected
by natural disasters in the country is massive. The most recent major disasters affecting the GDP
growth rate (see
Figure 55 )include the 2000 drought (1.2 million people affected, millions of
animals perished), the 2005 Kashmir earthquake (73,000 people died and 3.3 million homeless),
the 2007 Cyclone Yemyin (350,000 displaced, 1.5 million affected, more than 2 million livestock
perished) and the 2010 floods (2,000 dead, 20 million affected)
410
.
According to the World Bank,
poverty (at the national poverty line) in Pakistan fell from 64.3% in 2001 to 29.5% in 2013
411
.
Rural poverty remains a pressing issue as about 61% of the population lives in rural areas (see
410
https://www.dawn.com/news/661518411
http://data.worldbank.org/country/pakistan4,5%
5,1%
7,7%
1,8%
3,7%
5,0%4,8%
1,0%
2,6%
3,7%
4,3%
2,0%
3,2%
4,8%
7,4%
7,7%
6,2%
4,8%
1,7%
2,8%
1,6%
2,7%
3,5%
4,4%
4,7%4,7%
0,0%
1,0%
2,0%
3,0%
4,0%
5,0%
6,0%
7,0%
8,0%
9,0%
GDP growth rate (nnual %)