


 142 / 277

Education of Disadvantaged Children in OIC:
The Key to Escape from Poverty
132
to inequality.
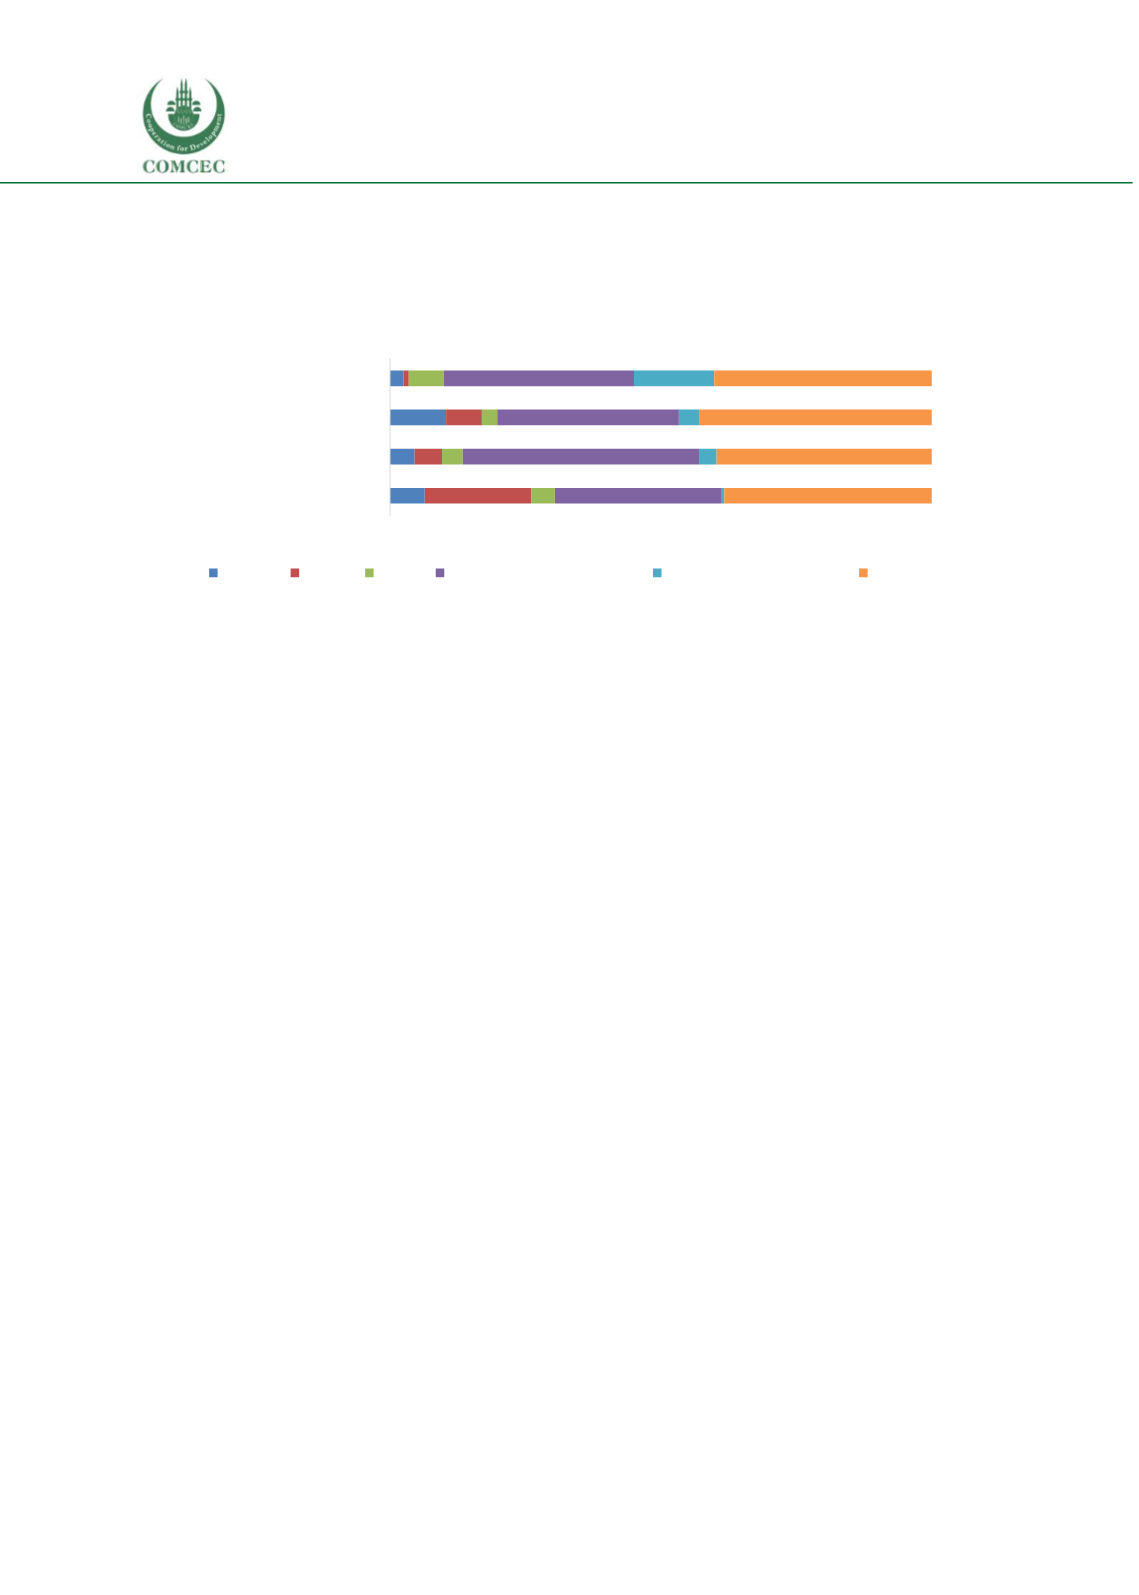
Taken together household wealth and household head’s education explain
around two-thirds of inequality of opportunities for all four outcome indicators on
education access.
Figure 50 Shapley decomposition using DHS 2012
Source: Authors’ calculations using DHS 2012
Overall,
region of the household, location of the household (urban/rural) gender of the
child and number of children in the household contribute very little to inequality
compared
to wealth and household head’s education. Only for completion rates of 8 years of education for
16-18 year olds does gender’s impact become significant. It makes up 19.7 percent of the overall
inequality pointing to gender inequalities for older children. The findings from the Shapley
decomposition fall perfectly in line with the discussions of correlations in the previous section.
Probit regression results
The DHS regression results show that generally, circumstances have an insignificant or very small
impact on attendance to school for younger children and finishing 5 years of education (see Annex
4 for details). Circumstances play a larger role on attendance to school of older children and
completion of 8 years of education.
Location, region, number of children:
In line with earlier results, regression results show that
living in rural areas is not negatively associated with education indicators for Jordan. The regional
disparities are also very small and negligible. The number of children in the household does not
affect education outcomes of the children.
Gender:
Gender does not create inequality of opportunities in Jordan, except for completion rates
of 8 years of education where boys are 2 percent less likely complete than girls i.e. gender has a
significant negative impact on school completion for older boys.
Poverty and education of head of household:
Poor children and children whose household
head has no education are less likely to attend school or finish school but the impact is smaller for
attendance to school for 6-11 year olds and completion of 5 years of education compared to
attendance to school for older children and completion of 8 years of education. In order words, in
line with both correlations and HOI findings, poverty has a larger negative impact on access to
schooling in older children and children from families where the head of household has no
education.
6,4
4,5
10,4
2,5
19,7
5,1
6,6
1,0
4,3
3,8
2,8
6,5
30,7
43,8
33,5
35,1
0,6
3,1
3,8
14,8
38,3
39,7
42,8
40,1
0 10 20 30 40 50 60 70 80 90 100
Finishing 8 years of education
Finishing 5 years of education
Attendance 12-15 year olds
Attendance 6-11 year olds
location gender region household head's education # of children in household wealth