


 141 / 277

Education of Disadvantaged Children in OIC:
The Key to Escape from Poverty
131
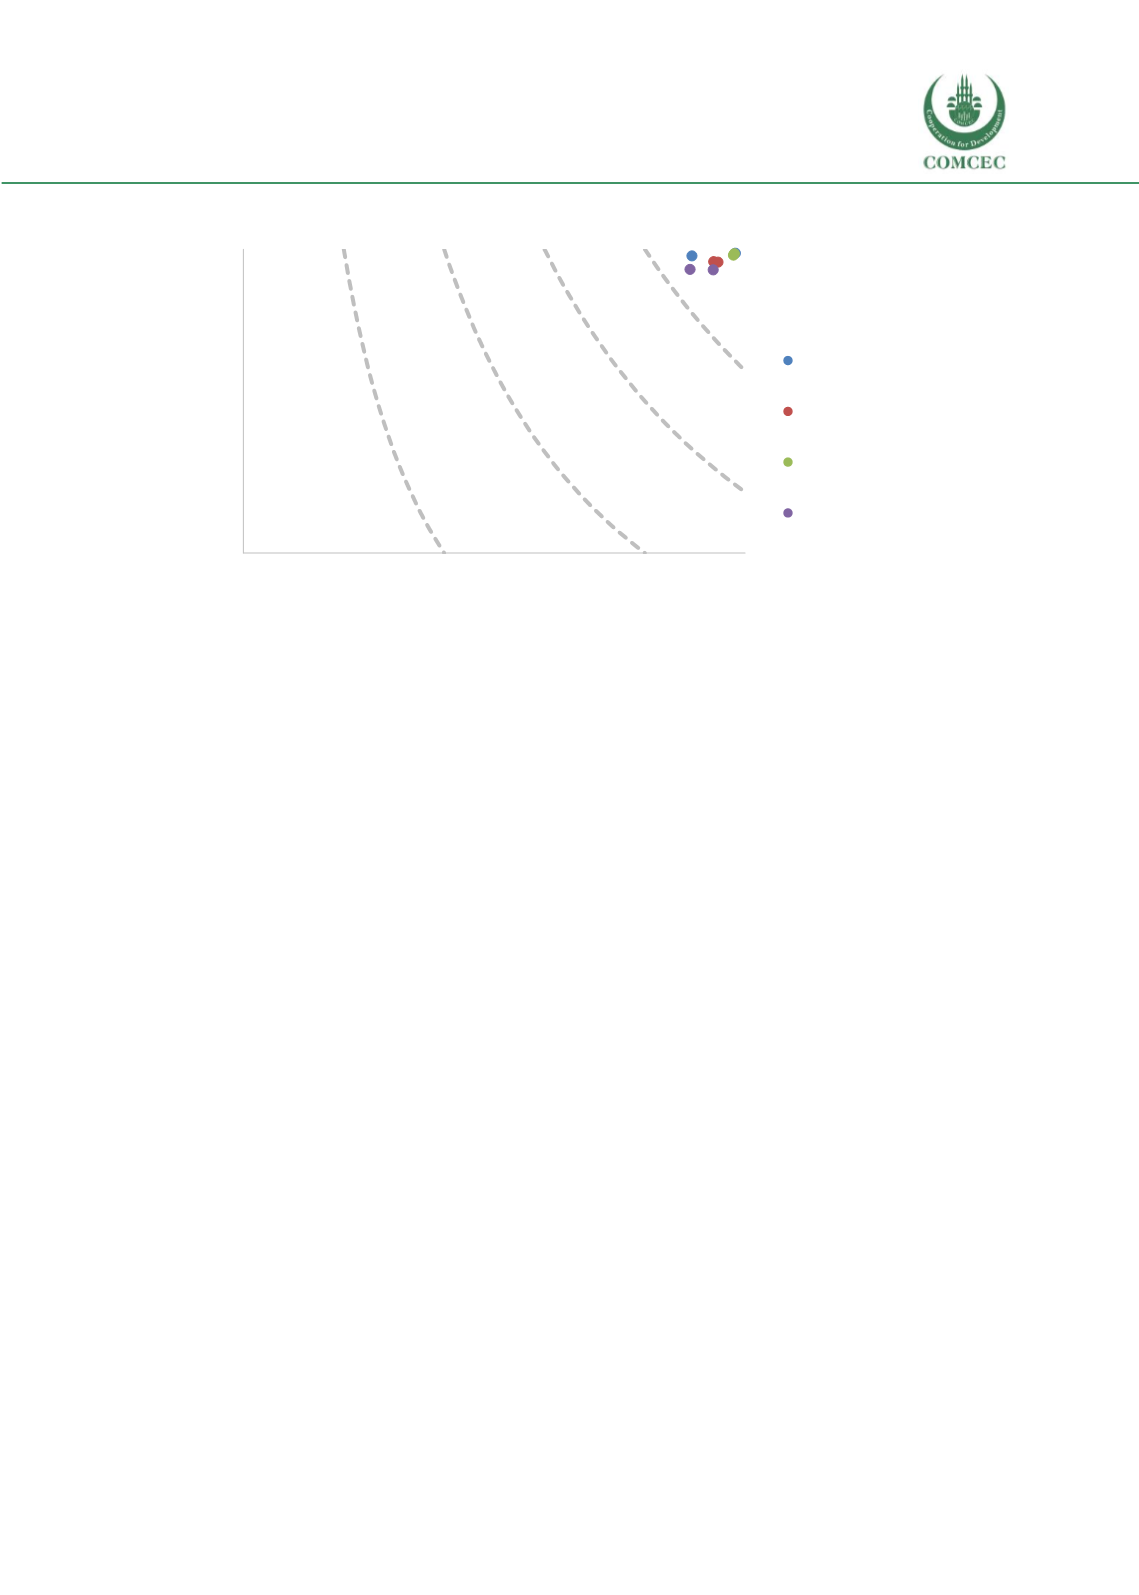
Figure 49 HOI, Coverage and Equality of Opportunities for Jordan, 1997-2012
Source: Authors’ calculations using DHS 1997 and DHS 2012
Both for indicators on attendance to school and indicators on finishing education, HOI is above 90
percent. In 2012, HOI was 97.4, 92.6, 97.2, 90.4 percent respectively for attendance to school for
6-11 year olds, attendance to school for 12-15 year olds, finishing 5 years of education and
finishing 8 years of education. While overall the HOI is high for all four indicators, there is still
room for progress for attendance to school for 12-15 year olds and for finishing 8 years of
education.
This corroborates the findings in section 2.2 regarding the relatively lower
access to education in children of secondary level age vs primary level age.
HOI was already high in 1997 for Jordan for education indicators and in the 15 years
between 1997 and 2012 it continued to improve.
HOI was 88.4, 91.8, 96.7 and 86.1 percent
respectively for attendance to school for 6-11 year olds, attendance to school for 12-15 year olds,
finishing 5 years of education and finishing 8 years of education. Equality of opportunities was
already high in 1997 with D-indices of 1.1, 2, 1, and 3.3.
In other words in 1997 only 1.1 percent
of the coverage on attendance of 6-11 year olds needed to be reallocated to the worse off
groups to achieve full equality in coverage across groups.
Consequently, advances in the HOI
between 1997 and 2012 are mostly due to increases in coverage. Coverage increased especially
for attendance to school for 6-11 year olds and finishing 8 years of education. Coverage of
attendance to school for 6-11 year olds increased from 89.4 to 98 percent during this time period
while coverage of finishing 8 years of education for 16-18 year olds increased from 89 percent to
93.6 percent.
Shapley Decomposition:
While the inequalities are very low for access to education and finishing
it, the remaining inequalities are mostly wealth related (See
Figure 50). Shapley decomposition
results show that for Jordan in 2012, wealth is the factor that contributes the most to inequality
for attendance to school for 6-11 year olds, attendance to school for 12-15 year olds and for
completion rates of 8 years of education for 16-18 year olds. For completion rates of 5 years of
education for 12-15 year olds, household head’s education is the factor that contributes the most
2012
1997
2012
1997
2012
1997
2012
1997
50
60
70
80
90
100
0
20
40
60
80
100
Equality of Opportunity (1-D)
Coverage
Attendance 6-11 year
olds
Attendance 12-15
year olds
Finishing 5 years of
education
Finishing 8 years of
education
HOI=40%
HOI=60%
HOI=80%
HOI=20%