


 120 / 277

Education of Disadvantaged Children in OIC:
The Key to Escape from Poverty
110
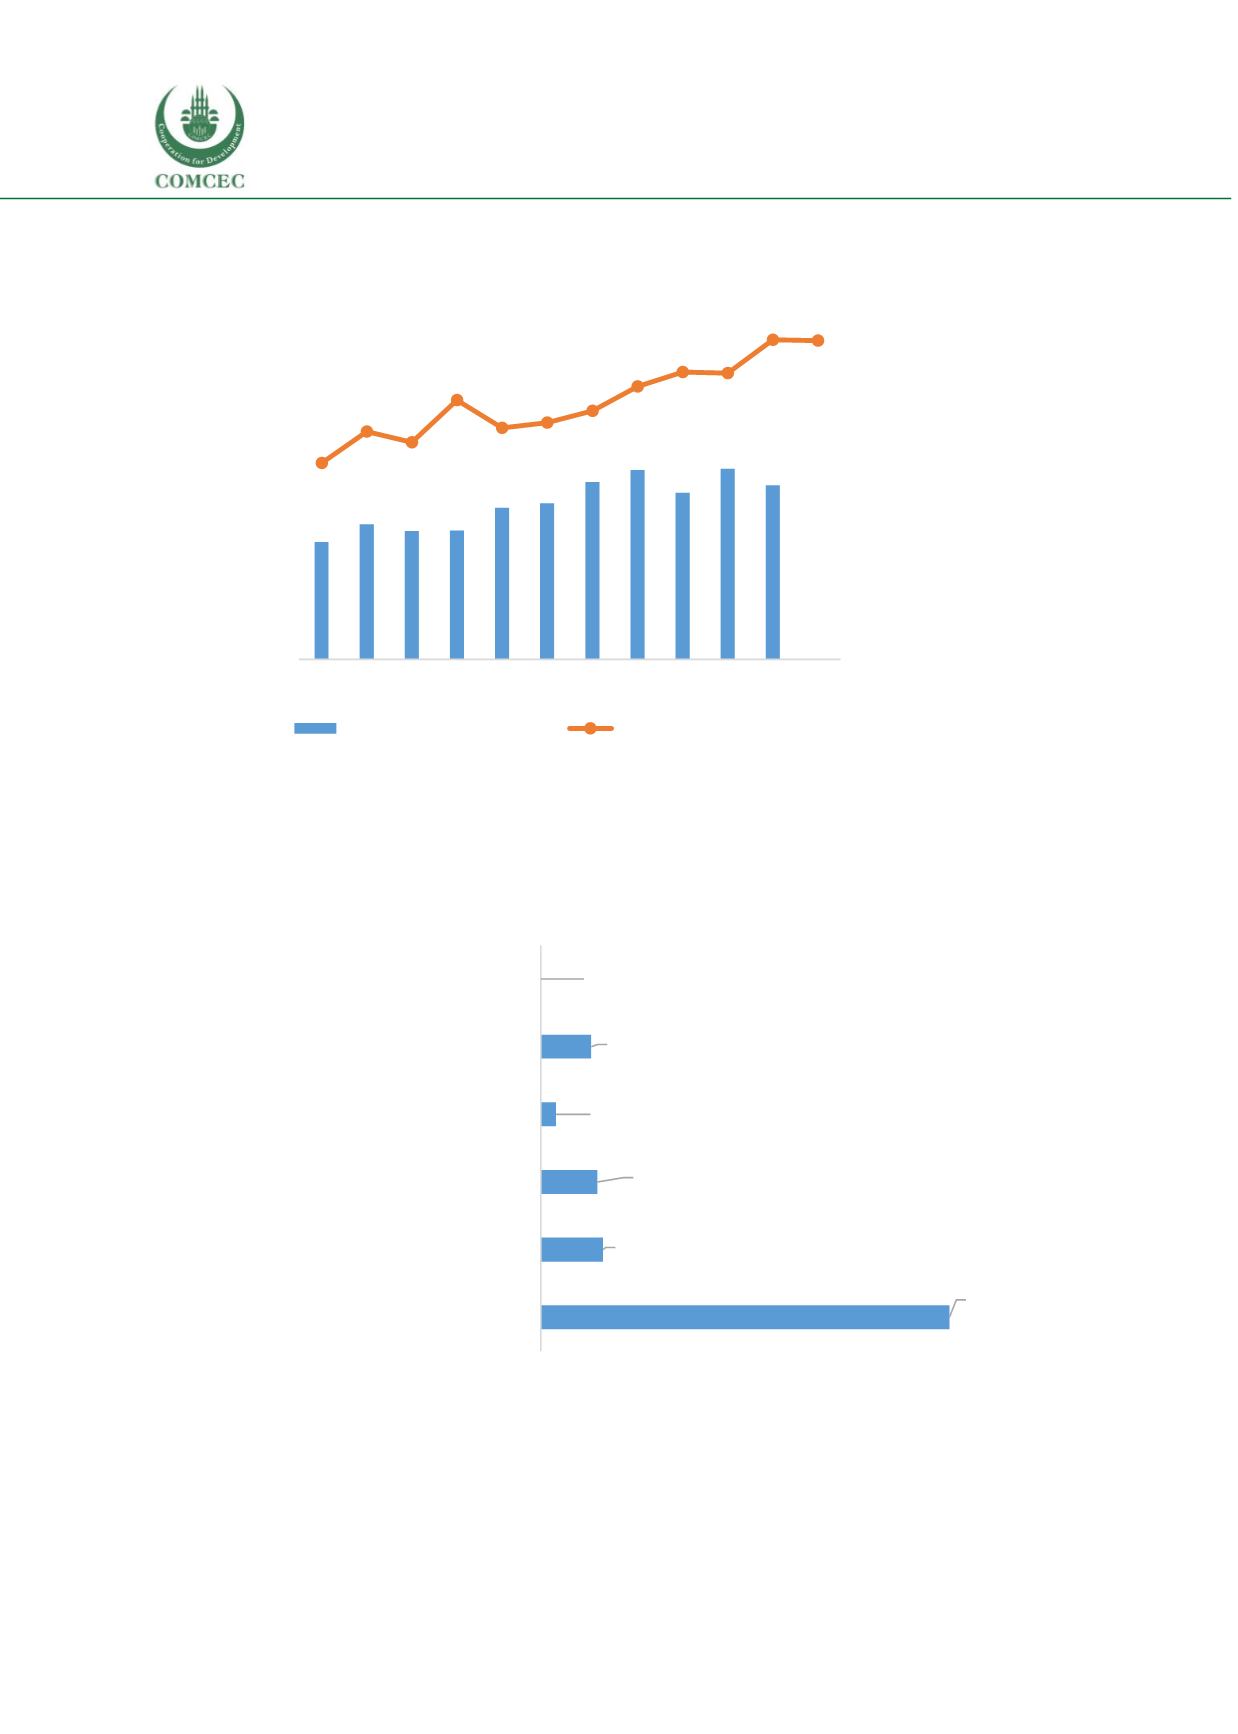
Figure 46 Distribution of MoNE's budget
Source: Ministry of National Education Strategy Development Presidency (2016)
68,85%
10,50%
9,53%
2,59%
8,51%
0,03%
0,00% 10,00% 20,00% 30,00% 40,00% 50,00% 60,00% 70,00% 80,00%
Human resources
Social security premiums
Purchase of goods and services
Transfers to public boarding schools and
bursaries
Financial expenses
Financial transfers
Figure 45 MoNE budget and its share in the GDP, 2006 - 2017
Source: Ministry of National Education Strategy Development Presidency (2016)
0,0%
0,5%
1,0%
1,5%
2,0%
2,5%
3,0%
3,5%
4,0%
$-
$5,0
$10,0
$15,0
$20,0
$25,0
$30,0
$35,0
$40,0
$45,0
$50,0
2007 2008 2009 2010 2011 2012 2013 2014 2015 2016 2017
% of GDP
billion USD
MoNE budget (left axis)
share in the GDP (right axis)