


 116 / 277

Education of Disadvantaged Children in OIC:
The Key to Escape from Poverty
106
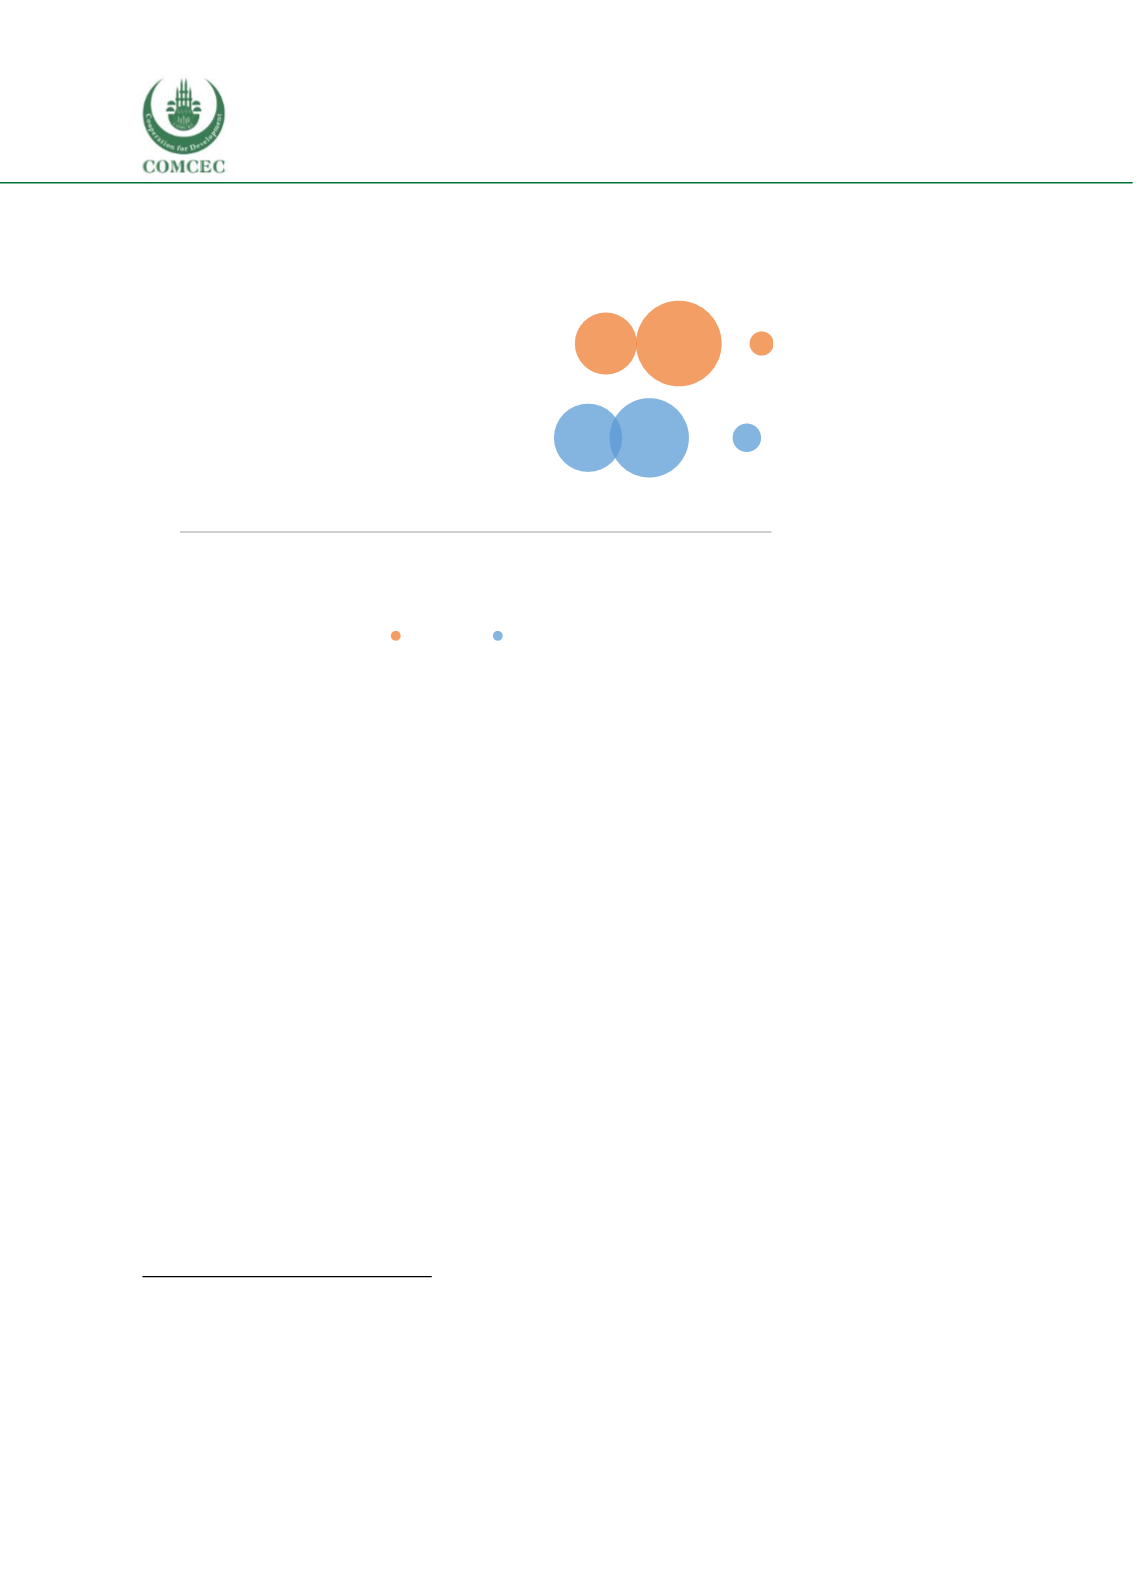
Figure 44 Home resources and average score, TIMSS 2015 Mathematics
Source:
TIMSS 2015 Report. Bubble size reflects the percentage of pupils in that group.
Challenges, Barriers, and Bottlenecks
Access to Education
Absenteeism of students:
With the introduction of 8 years of compulsory education in 1999,
access to education, particularly at the primary level, significantly increased in Turkey. As
previous sections in this chapter showed, inequalities in access to education decreased, whereas
there is still a way to go in increasing completion rates in higher levels of education. Challenges in
education are not limited to completion rates. While enrolment rates at the basic education level
are getting closer to 100 percent year by year, absenteeism in primary and secondary education
is a problem that is clearly defined in the MoNE’s 2015 – 2019 strategic plan.
279
Analysis of e-
school data in a 2014 research study jointly organised by the Education Reform Initiative (ERI),
MoNE and UNICEF Turkey indicates that “unexcused absence” both in primary and lower
secondary education increased over the years. While average unexcused absence days in the first
five years was 3.2 days in 2007, it reached 5.8 days in 2011. In lower secondary education, these
days are even higher. In 2011, average unexcused absence reached 11.6 days. These analyses also
find that between 2007 and 2010, the number of students who were absent more than 30 days
without any excuse has quadrupled.
280
281
279
Ministry of National Education Strategy Development Presidency (2015)
280
Börkan, Levent, Dereli, Bakış, and Pelek (2014)
281
However PISA 2015 results show that absenteeism is on a decline for the sample of PISA students (mostly 9th and 10th
graders for Turkey). Yet despite the declining trend, the absenteeism remains high compared to OECD averages (Source:
http://pisa.meb.gov.tr/wp-content/uploads/2014/11/PISA2015_UlusalRapor.pdf)
Many resources
Some resources
Few resources
Many resources
Some resources
Few resources
0
100
200
300
400
500
600
Average scores
4th grade 8th grade