
Increasing Broadband Internet Penetration
In the OIC Member Countries
86
OIC
Member
Countries
All Countries (only major countries cited)
•
Polynesia: 47.33%
•
South-Eastern Asia (Brunei, Cambodia, Indonesia, Lao, Malaysia, Myanmar, Philippines,
Sri Lanka, Thailand, Vietnam): 34.17%
•
Southern Asia (Afghanistan, Bangladesh, Bhutan, India, Iran, Maldives, Nepal, Pakistan,
Singapore): 24.53%
Arab 39.53%
•
Western Asia (Armenia, Azerbaijan, Bahrain, Cyprus, Georgia, Iraq, Israel, Jordan,
Kuwait, Lebanon, Oman, Palestine, Qatar, Saudi Arabia, Syria, Turkey, UAE, Yemen):
50.35%
Sources: International Telecommunicatio s Union; Telecom Advisory Services analysis
The differences between OIC Member Countries and all other countries by region have to be
interpreted with caution. For example, the 10 percentage point difference between Arab OIC
Member Countries and Western Asian countries is due to the fact that the latter includes
Armenia, Azerbaijan, Cyprus, Georgia, Israel and Turkey, countries with high Internet
penetration which increase the prorated average. On the other hand, the Asian OIC Member
Countries (Internet penetration: 28.03%) represent a prorated average of Central Asia
(43.98% Internet penetration) and some Southern Asian countries (Internet penetration:
24.53%). Finally, African OIC Member Countries (Internet penetration: 27.90%) represent the
average countries in all African regions, except for Southern Africa.
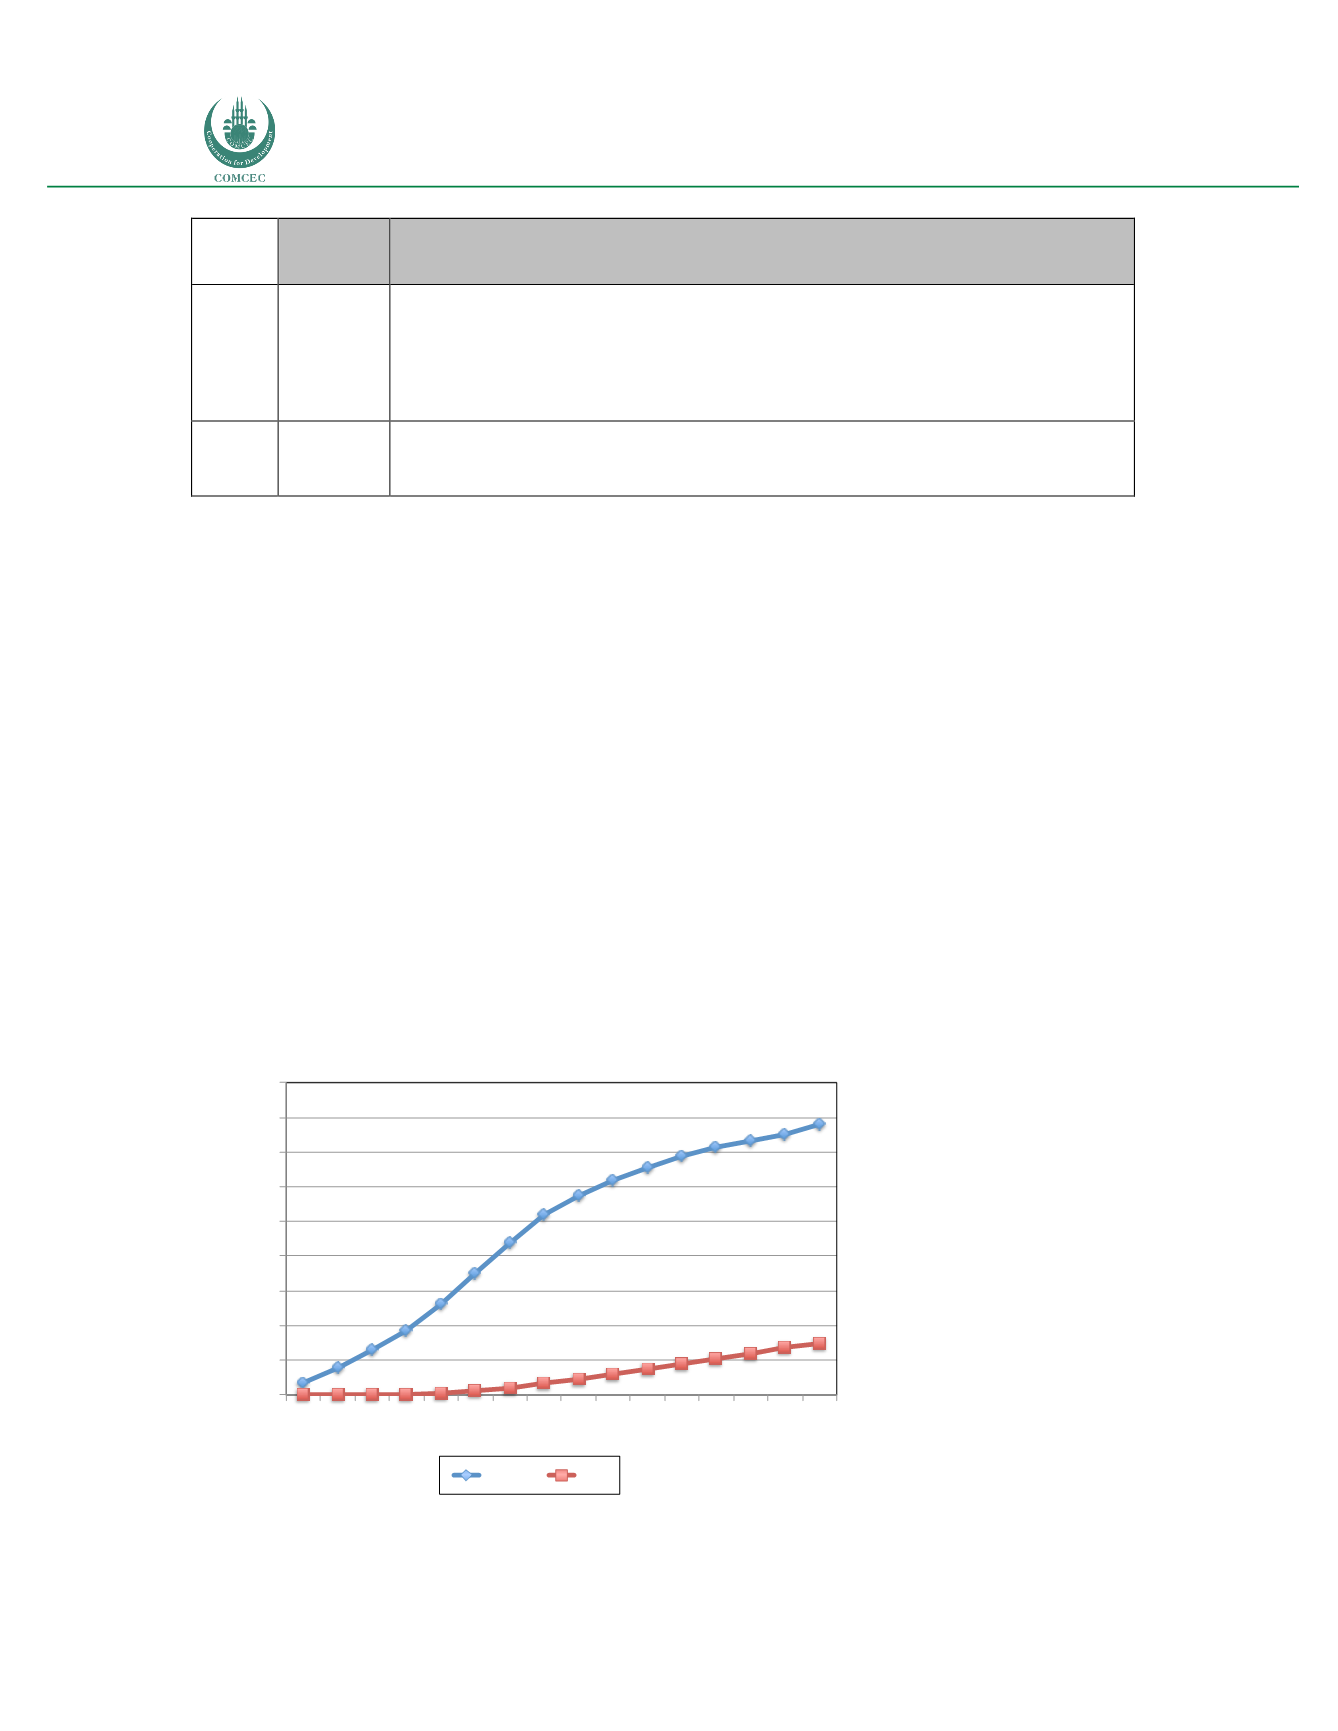
In the case of fixed broadband, as of 2015, penetration within the OIC Member Countries has
reached 14.95% of total households, compared to 78.07% in OECD countries. In addition to the
significant difference between both groups of countries, it should be noted that fixed
broadband among the OIC Member Countries has not been increasing at a pace comparable to
Internet adoption (see figure 22).
Figure 22: OECD vs. OIC Member Countries: Fixed broadband penetration (2000-2015)
(percent of households)
Sources: International Telecommunications Union; Telecom Advisory Services analysis
4%
8%
13%
19%
26%
35%
44%
52%
58%
62%
66%
69% 71% 73% 75%
78%
0% 0% 0% 0% 0% 1% 2% 3% 5% 6% 7% 9% 11% 12% 14% 15%
0.00%
10.00%
20.00%
30.00%
40.00%
50.00%
60.00%
70.00%
80.00%
90.00%
2000
2001
2002
2003
2004
2005
2006
2007
2008
2009
2010
2011
2012
2013
2014
2015
OECD OIC


