
Increasing Broadband Internet Penetration
In the OIC Member Countries
75
impact on the speed at which broadband subscribers can access the Internet. According to the
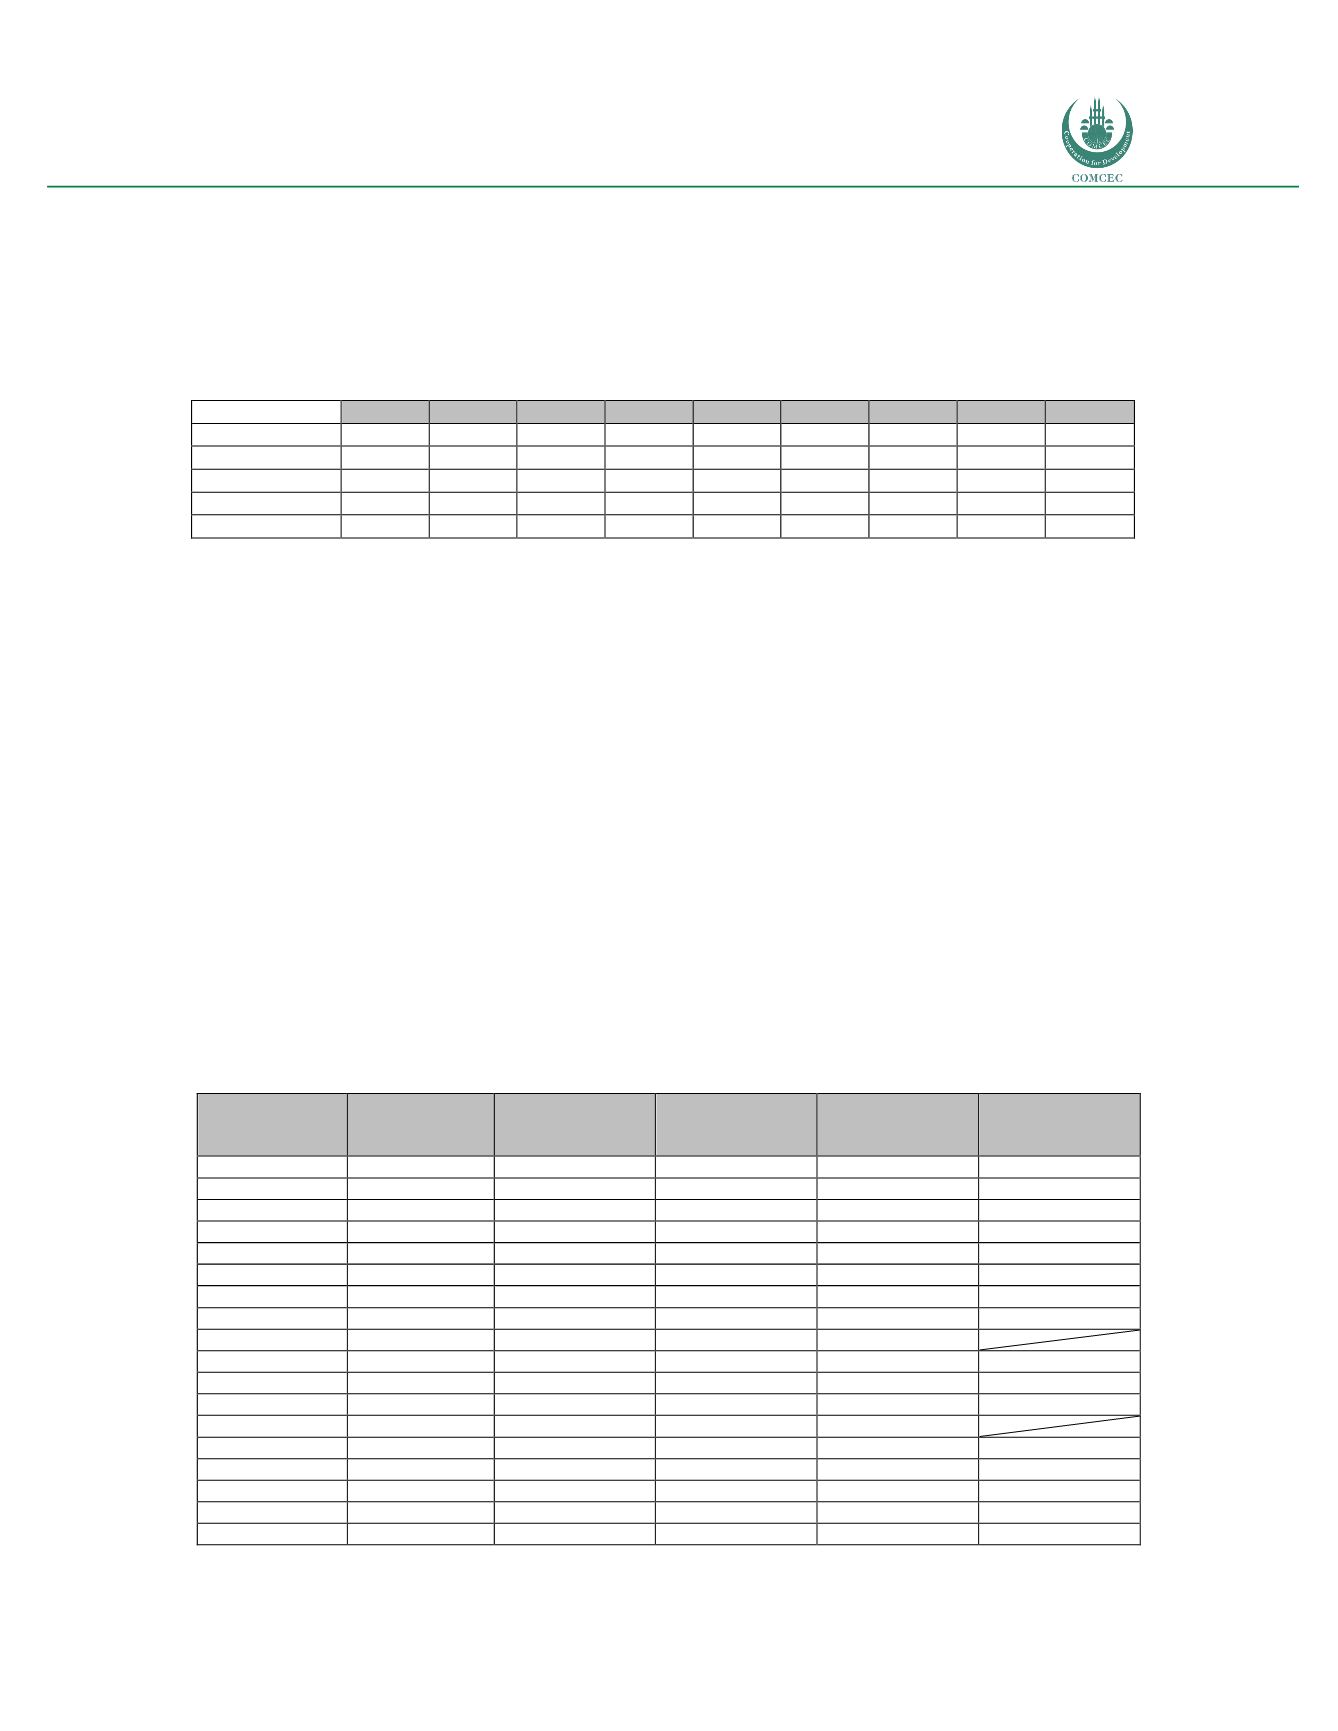
table 25 the average fixed broadband download speed across the OIC Member Countries is 3.4
Mbps.
Table 25: OIC Member Countries and OECD: Average fixed broadband speed (in Mbps)
(2015)
2007 2008 2009 2010 2011 2012 2013 2014 2015
OECD
3,680 3,978 4,125 4,231 5,230 6,126 8,656 9,974 11,669
Asian OIC
754
837
873
827 1,038 1,384 1,902 2,363 3,556
Arab OIC
1,005 1,008 1,232 1,299 1,291 1,529 1,766 2,267 3,149
African OIC
N/D N/D N/D N/D N/D N/D N/D N/D N/D
Total OIC
822
884
972
958 1,108 1,425 1,864 2,336 3,442
Source: Akamai; Telecom Advisory Services analysis
As table 25 indicates, the average download speed has not improved significantly in the last
nine years, when it was 1.005 Mbps. In the meantime, the average download speed across
OECD countries has increased from 3.680 Mbps to 11.669 Mbps. As research has indicated,
broadband speed has a direct economic impact. In the emerging world, upgrading from 0.5 to 4
Mbps increases household income by US$ 46 per month (Bohlin, 2014). Similarly, doubling of
broadband speed increases GDP by 0.3%. These effects emphasize the need to accelerate
deployment of fast fixed broadband across the OIC Member Countries. This challenge will be
discussed further in chapter V.
The statistics for mobile broadband speeds point out to a similar lag by the OIC Member
Countries, although the deployment of 4G/LTE is expected to increase the share of faster
mobile broadband connectivity. As of the end of 2016, 41 OIC Member Countries have at least
one operator with an active LTE network. Of these, Kuwait, Malaysia, Saudi Arabia and the
United Arab Emirates have begun to reflect a growing 4G share of the total mobile broadband
subscriptions (see table 26).
Table 26: OIC Member Countries: Breakdown of mobile broadband subscribers
Subscriptions
per 100 pop.
Total
Subscribers
(2015)
Share 3G (*) (
%
) Share 4G (*)(
%
)
Year Launched
(first operator)
Kuwait
139.31
4,992,033
81.30 (2015)
18.70 (2015)
2011
Bahrain
131.78
1,791,892
- - -
- - -
2012
Saudi Arabia
111.67
33,387,589
94.84 (2015)
5.16 (2015)
2011
UAE
91.99
8,810,000
94.84 (2015)
5.16 (2015)
2011
Malaysia
89.94
27,567,668
94.40 (2015)
5.60 (2015)
2013
Qatar
80.03
1,881,144
98.00 (2015)
2.0 (2015)
2013
Oman
78.26
3,253,949
- - -
- - -
2013
Suriname
75.85
416,004
- - -
- - -
2015
Maldives
63.64
227,820
100
0
Tunisia
62.63
7,036,966
99.19 (2015)
0.81 (2015)
2015
Azerbaijan
60.92
5,856,215
100
0
2016
Kazakhstan
59.97
10,057,237
98.47 (2015)
1.53 (2015)
2012
Lebanon
53.43
2,916,231
100
0
Turkey
50.94
39,067,554
100
0
2016
Egypt
50.66
42,913,302
100
0
2018
Indonesia
42.05
107,518,000
99.87 (2015)
0.13 (2015)
2013
Albania
40.58
1,297,281
- - -
- - -
2015
Côte d'Ivoire
40.39
8,602,170
- - -
- - -
2014


