
Increasing Broadband Internet Penetration
In the OIC Member Countries
25
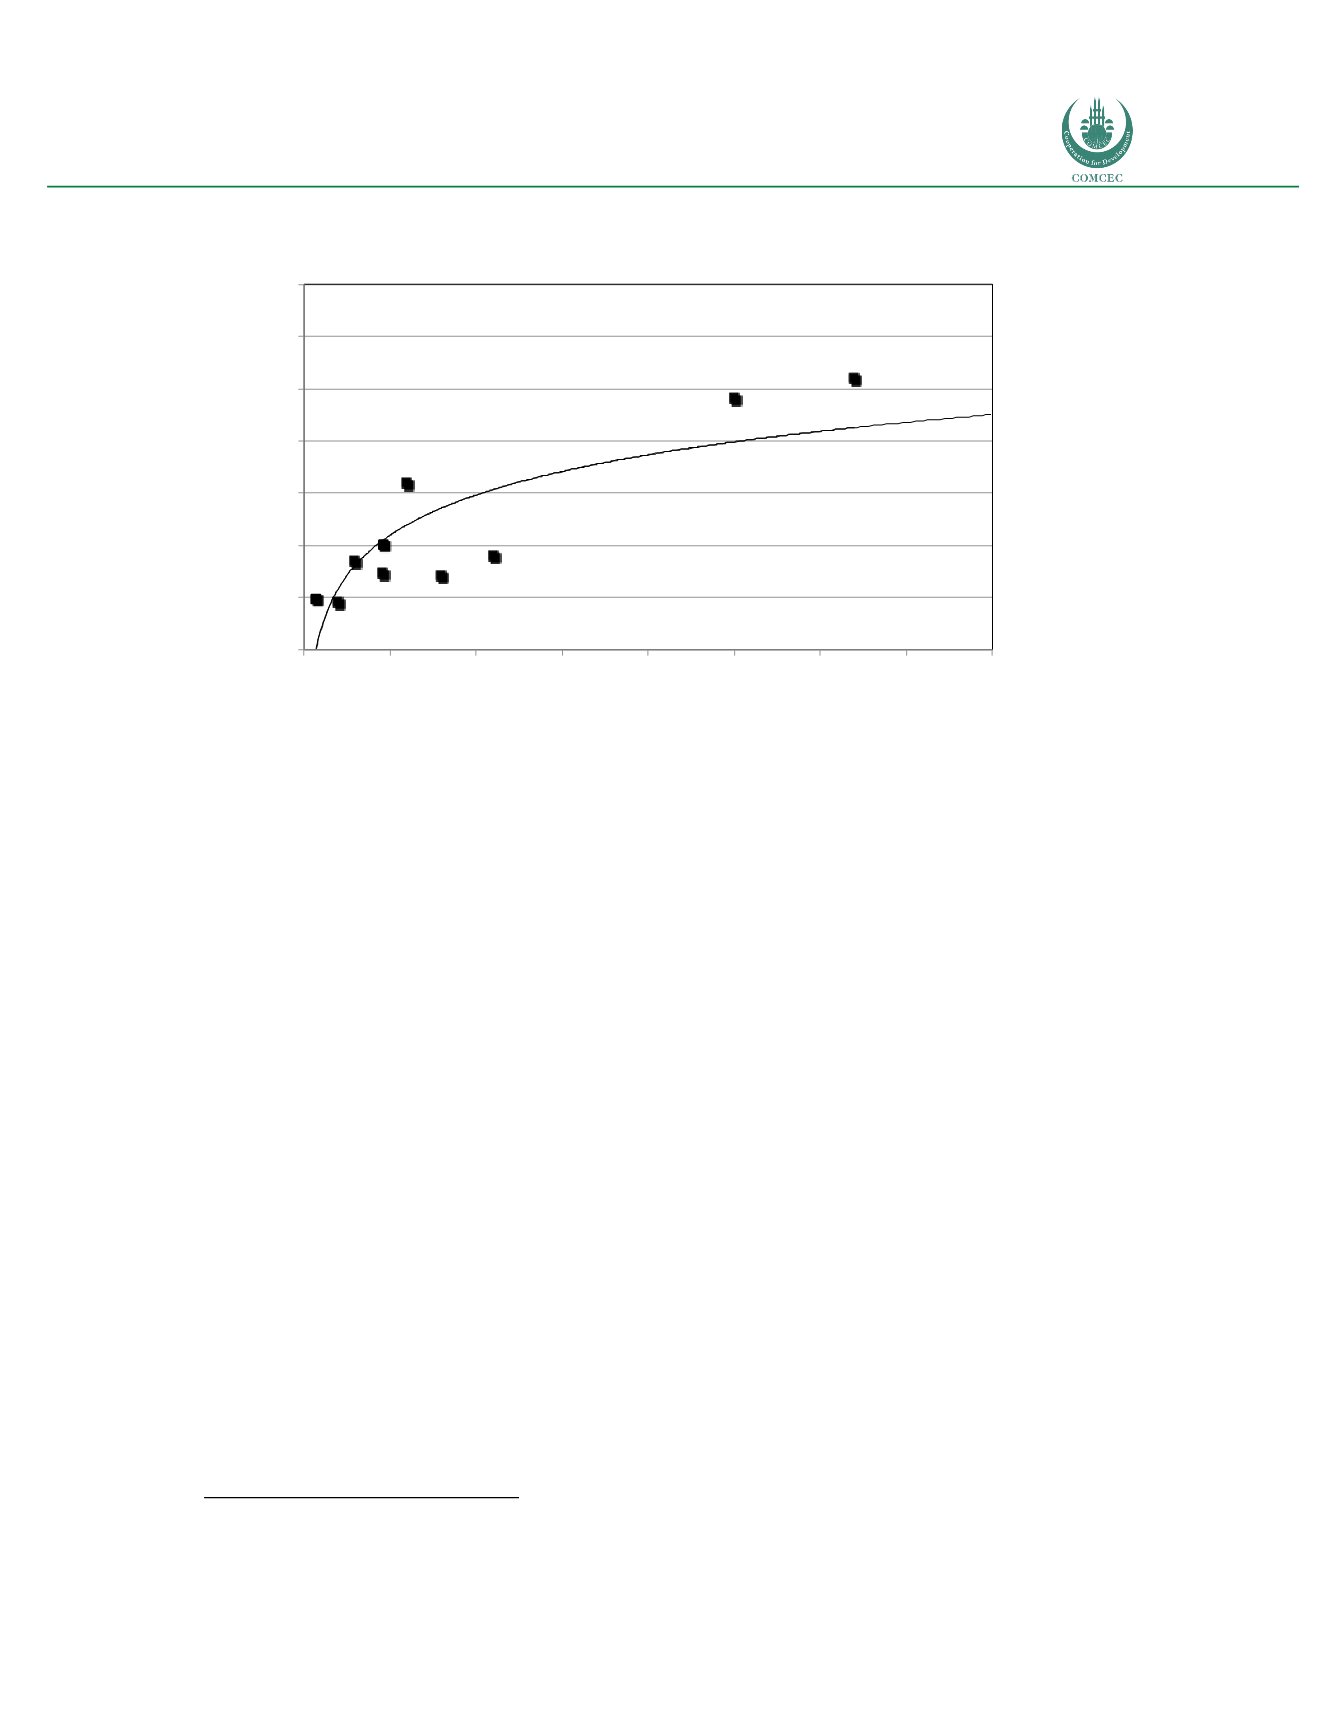
Figure 7: Fixed broadband economic impact vs. fixed broadband penetration
Source: Katz and Callorda (2016)
Figure 7 plots on the horizontal axis fixed broadband penetration and on the vertical axis the
contribution to GDP growth as calculated for several countries relying on a similar
econometric structural model based on simultaneous equations
10
. Validating the “return to
scale”, the figure indicates that the contribution to GDP growth increases with fixed broadband
penetration. For example, the contribution coefficient to GDP growth in Germany’s counties
with high (32%) and low (25%) population penetration is much higher (0.26 and 0.24
respectively) than in countries with lower fixed population penetration, such as Tunisia
(4.60%), with a contribution coefficient of 0.1010. The implications of these findings for
emerging countries are clear. Since the magnitude of economic contribution of broadband
technology increases with penetration, it is imperative that they strive to maximize overall
penetration.
The impact of broadband on job creation also varies between developed and emerging regions
within a single country. The research on broadband impact in Germany discussed above
highlighted differential job creation impact between advanced and emerging counties. In
counties with high broadband penetration, once penetration increased, the effect of job
creation is significant in the short term, fading over time due to a potential saturation effect.
On the other hand, in counties with low broadband penetration, the increase in broadband
deployment results in a negative impact on job creation (in other words, a reduction in the
number of jobs) in the short term, reaching a positive effect in the long term. A comparison of
these effects is presented in figure 8.
10
The models are compiled from different research articles from Koutroumpis (2009), Katz and Koutroumpis (2012), Katz
and Callorda (2014 and 2016).
0%
5%
10%
15%
20%
25%
30%
35%
0%
5%
10%
15%
20%
25%
30%
35%
40%
GDP Impact
Penetration
Morocco
(2014)
Jordan
(2014)
Tunisia (2014)
Germany High
Germany Low
LATAM
Brazil
Chile
Panama
Senegal
(2014)


