


 59 / 214

Improving Transnational Transport Corridors
In the OIC Member Countries: Concepts and Cases
45
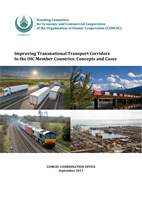
Table 3: EU Countries Exports to EU
*Average Annual Growth Rate
Source: Fimotions, 2017 (compilation based on Eurostat data).
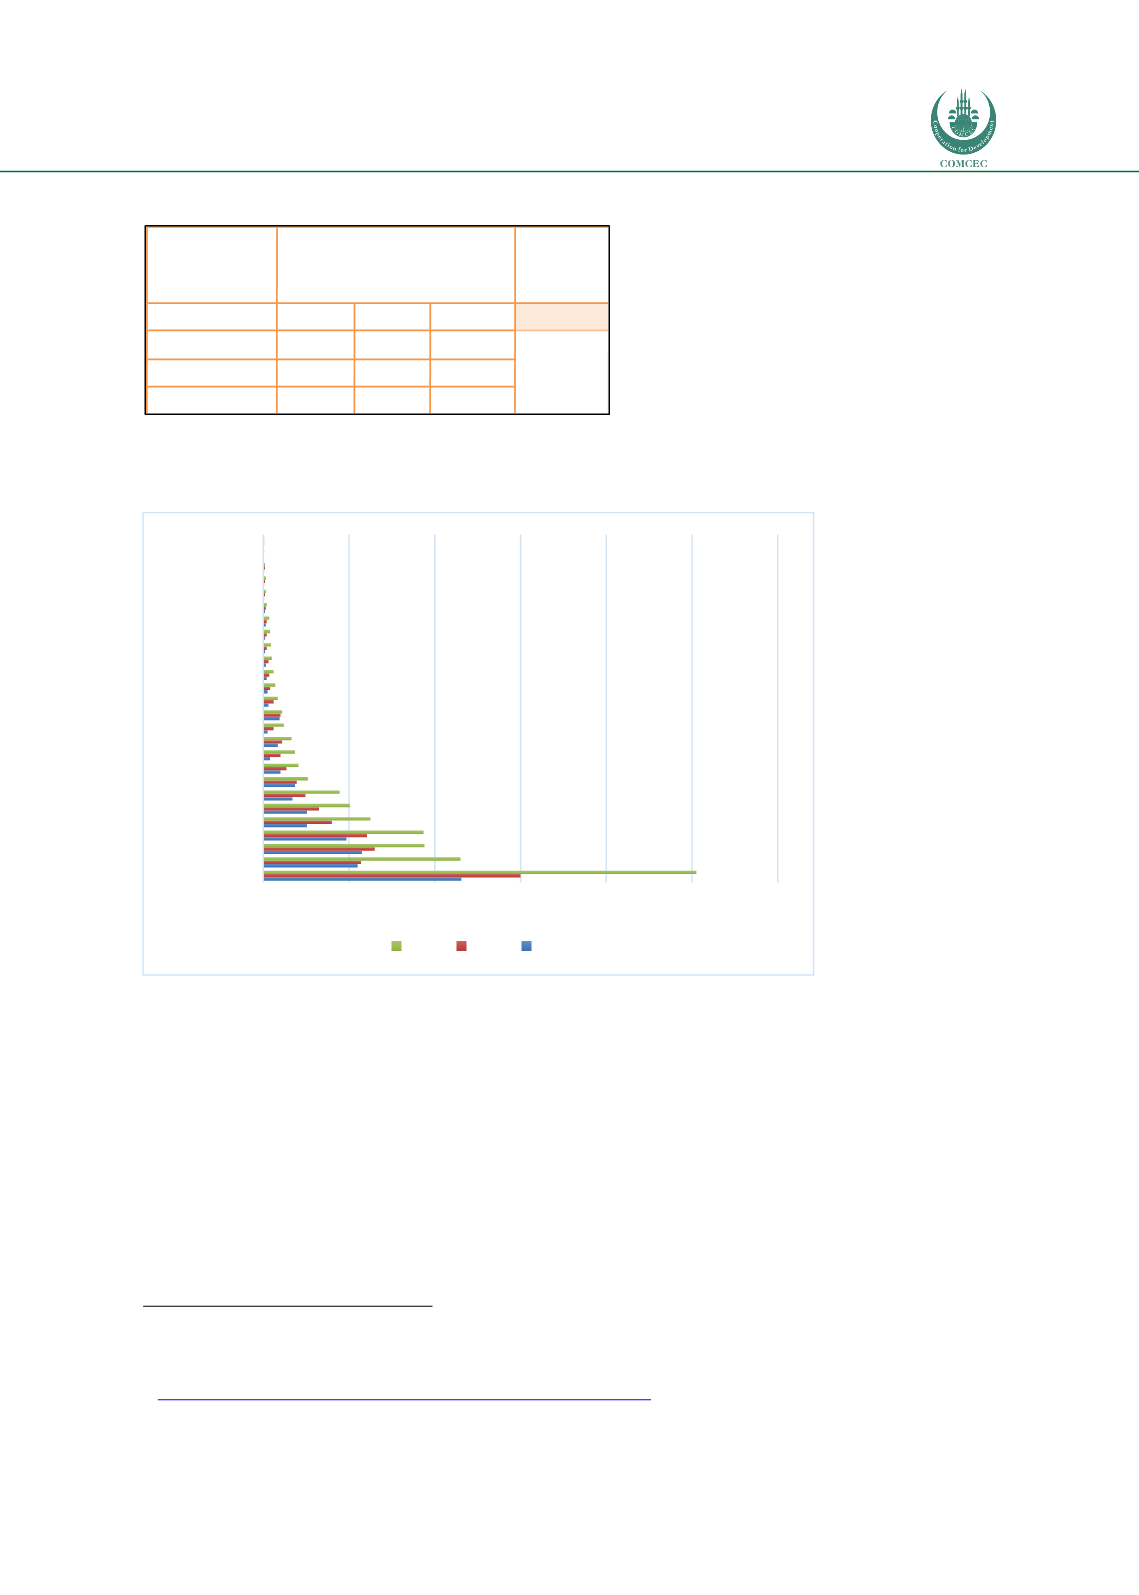
Figure 16: EU intra-regional trade
Source: Eurostat: Trade in Goods – Recent Trends
19
.
In terms of the logistics performance index, the mean LPI for all 28 EU countries is 3.61
20
with
Germany being the highest and 4.23 and Romania the lowest at 2.99. Important to note that
the recently joined members of the EU from Central Europe, including Poland, Hungary,
Romania, Estonia, Croatia, LPIs all increased some by up to 35% from the time of joining due to
the TEN T and removal of the NTBs. It would be fair to say that for new EU members and some
older ones like Portugal and Greece, the promise of funding road and rail improvements by the
EU helped to secure the removal of the NTBs, and hasten the political support. The carrot
offered of project funding generally helps to move the intransigence of the political donkey.
19
http://ec.europa.eu/eurostat/statistics-explained/index.php/Intra-EU_trade_in_goods_-_recent_trends2
0 http://data.worldbank.org/indicator/LP.LPI.OVRL.XQ?name_desc=falseEuropean Union
2003 2009 2015
Intra-Regional
2,829 3,063 3,740
3%
External Trade 1,756 3,096 3,453
Total Trade
4,585 6,159 7,193
Percentage
62% 50% 52%
EU Countries Exports to EU
(in Euro Billions)
AAGR*%
0
100
200
300
400
500
600
Germany
France
Netherlands
Spain
Austria
Denmark
Finland
Romania
Slovakia
Bulagria
Croatia
Latvia
Cyprus
2015 2009 2003