
Improving Transnational Transport Corridors
In the OIC Member Countries: Concepts and Cases
43
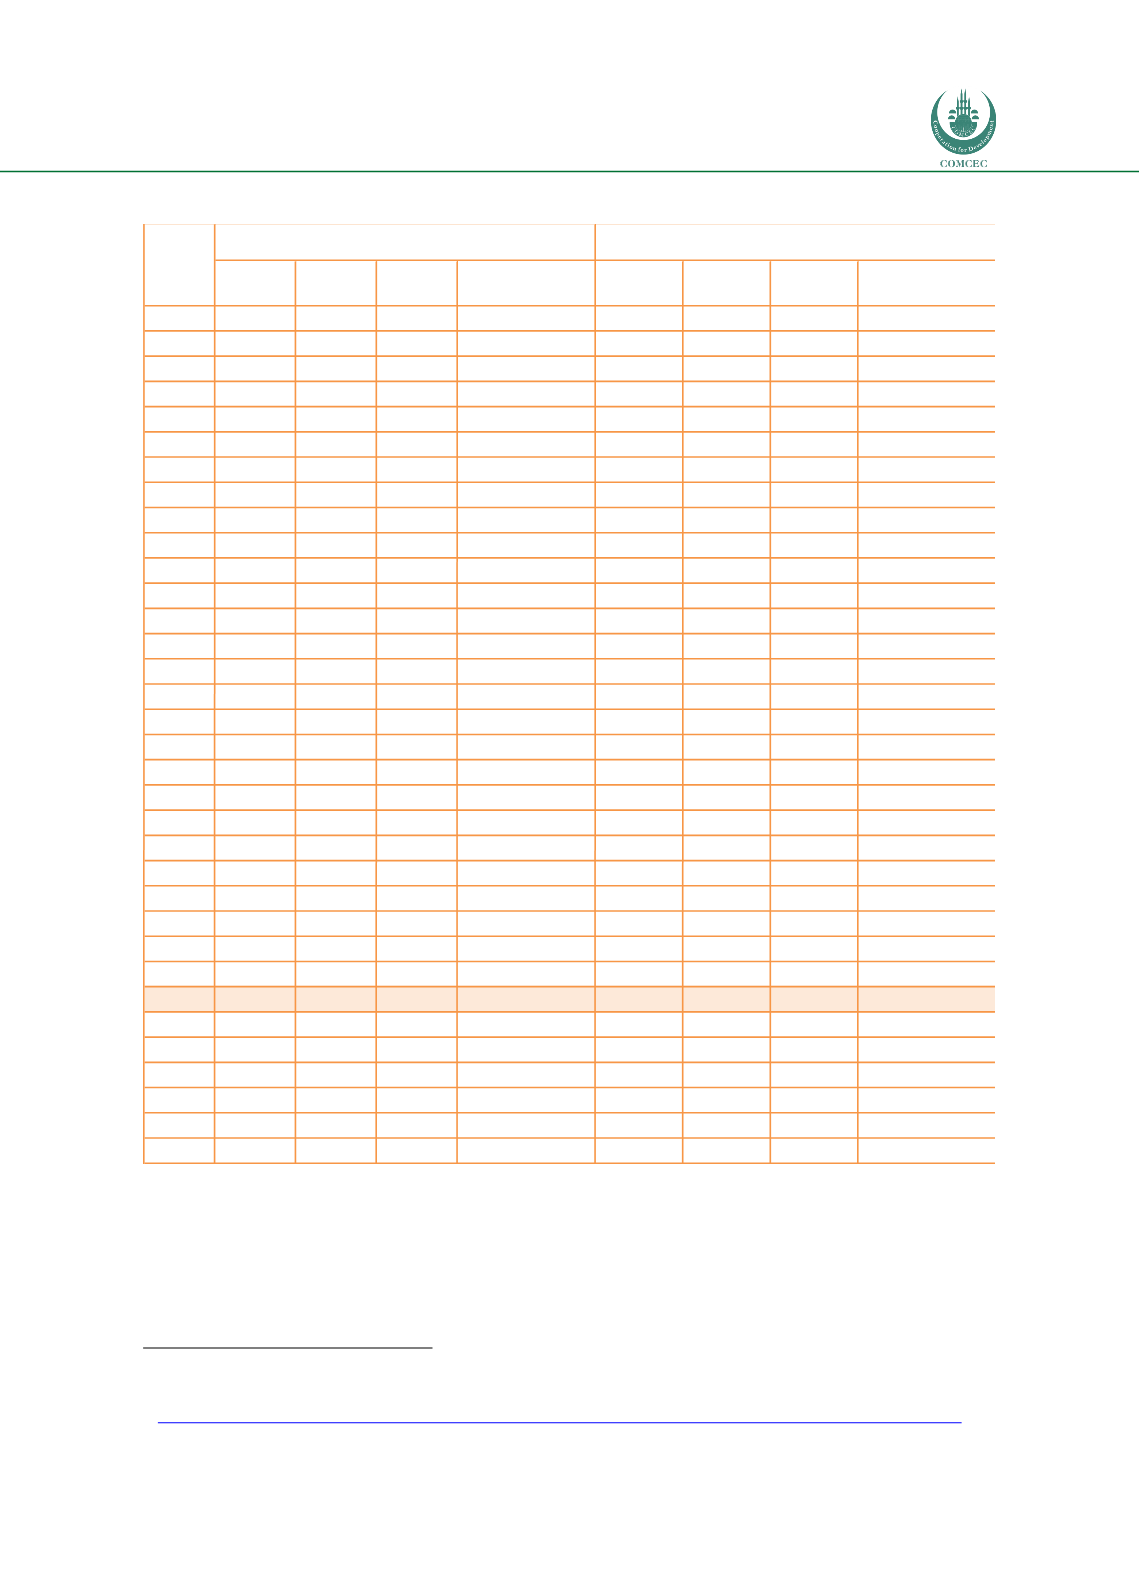
Table 2: Cabotage transport – in million ton-kilometers and as % in EU total
Source: EuroStat (2010)
18
.
The data show that the general tendency for cabotage is to increase, with substantial rises
since 2004 for Finland, the Czech Republic, Greece, Sweden and Denmark. Even the newer
Member States saw rises in cabotage performed in their country. This can be interpreted as
healthy sign of growing competition in the TEN-T region.
1
8 http://ec.europa.eu/eurostat/statistics-explained/index.php/Archive:Competitiveness_in_EU_road_freight_transport2004 2006 2008
% share in EU
total -2008
2004 2006 2008
% share in EU
total -2008
BE
1,816 1,552 1,546
8,8% 574
705
890
5,5%
BG
-
204
137
0,8% 11
15
3
0,0%
CZ
5
86
293
1,7% 27
68
72
0,4%
DK
254
239
254
1,4% 184
203
375
2,3%
DE
1,944 2,273 2,781
15,8% 3,794 3,479 3,639
22,4%
EE
57
102
216
1,2% -
2
2
0,0%
IE
505
434
573
3,3% 122
177
-
0,0%
EL
17
89
18
0,1% 60
145
159
1,0%
ES
1,031
854 1,085
6,2% 929
1,403
975
6,0%
FR
624
523
429
2,4% 4,586 4,521 5,417
33,4%
IT
847 1,022
939
5,3% 1,001 1,037 1,062
6,5%
CY
-
-
-
-
-
-
-
-
LV
10
30
50
0,3% 20
2
9
0,1%
LT
28
66
75
0,4% 5
4
5
0,0%
LU
2,262 2,133 2,695
15,3% 11
18
7
0,0%
HU
92
80
168
1,0% 29
37
20
0,1%
MT
:
:
:
: :
:
-
:
NL
2,871 2,172 2,563
14,6% 257
388
432
2,7%
AT
390
717
642
3,7% 245
284
415
2,6%
PL
506 1,273
954
5,4% 42
22
43
0,3%
PT
708
714
886
5,0% 69
23
5
0,0%
RO
:
14
97
0,6% 22
44
8
0,0%
SI
132
264
389
2,2% 2
-
3
0,0%
SK
89
125
264
1,5% 7
22
33
0,2%
FI
70
88
33
0,2% 14
26
34
0,2%
SE
170
164
222
1,3% 356
547
932
5,7%
UK
203
242
272
1,5% 1,855 1,760 1,689
10,4%
EU-27
14,631 15,460 17,571
100% 14,221 14,931 16,229
100%
HR
:
:
2
-
1
2
3
-
MK
:
:
- :
16
21
-
TR
:
:
-
6
25
12
-
LI
22
18
10
-
-
:
-
-
NO
12
19
47
-
197
152
193
-
CH
:
:
275
-
51
107
67
-
Cabotage performed by each country
Cabotage performed in each country


