
Improving Transnational Transport Corridors
In the OIC Member Countries: Concepts and Cases
134
4.6.4.
Trade Facilitation
Northern Corridor operations are based on the NCTA. The NCTA, signed in 1985, came into
force in 1986 after the necessary ratification and asserts the following:
Ensure freedom of transit among the member states
Safeguard right to access to/from the sea for landlocked countries
Develop and integrate the regional transport facilities and services
Facilitate inter-state and transit trade
The Democratic Republic of Congo became the fifth member after acceding to the Agreement
in 1987.
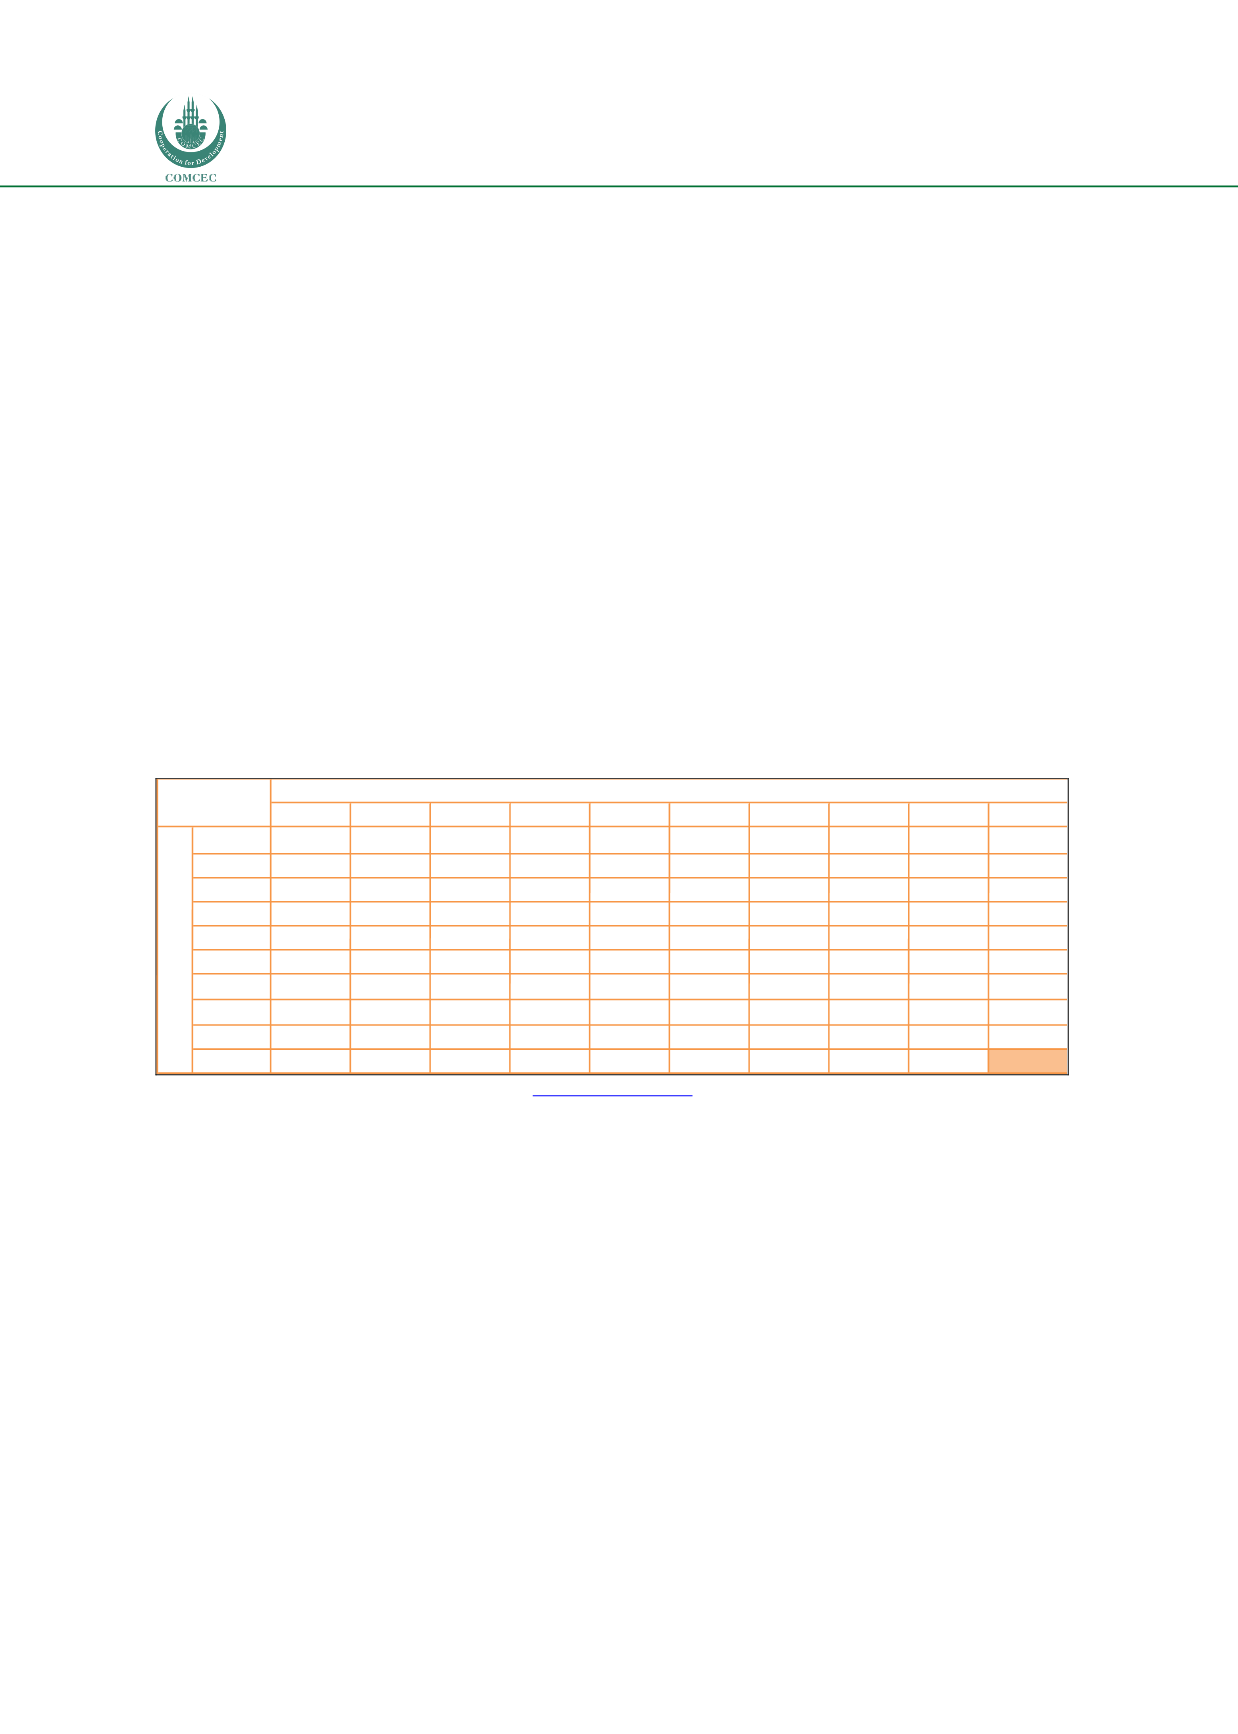
Trade between member states and the rest of the world is shown in
Table 43 .The most
important aspect to note is that intra-regional trade is 18% of total trade, so much higher than
the 6% between TAH1 participants. The reason is more likely to historic than due to the
transport corridor since Kenya, Uganda, and Tanzania were part of the East African
Community for many years and also during British colonial era.
Table 43: Trade matrix NTTC in 2015
Source: Fimotions (2017), analysis on data o
n www.trademap.org .Trade Facilitation programs include:
Simplification, rationalization, harmonization, standardization and modernization of
trade business processes and documentation;
Rationalization and minimization of trade transaction costs;
Promotion of private sector participation in policy formulation and implementation of
activities relating to trade and transport facilitation;
Improving industry service standards and encouraging self-regulation;
Harnessing ICTs towards a smart Corridor.
Because of this long-standing and ratified agreement, the analysis of the Northern Corridor has
shown that its performance has improved and the delays experienced in 2009 have
disappeared. It shows that through coordinated working the costs of trading can be reduced
UGAN RWAN BUR KENYA DRC
S. SUDAN N. TANZ Total
World
%
UGAN
237.57 46.28 427.01 152.56 265.03 60.76
1,189 2,267 52.5%
RWAN
9.37
6.41 90.38 186.53
5.34
1.11
299
579 51.7%
BUR
3.38
4.63
13.43 28.27
N/A 2.19
52
114 45.6%
KENYA
554.53 147.98 36.22
239.23 225.75 237.32
1,441 5,628 25.6%
DRC
3.64 11.02 36.22
2.96
N/A 0.63
54 6,313 0.9%
S. SUDAN
0.84
0.00
N/A 14.02
N/A
N/A
15 2,335 0.6%
N. TANZ
62.89 41.30 44.03 793.89 198.29
0.10
1,141 5,854 19.5%
Total
635
443
169 1,342
805
496
302 4191.1
World
5,528 1,858
561 19,430 5,812
623 14,706
23,091
%
11.5% 23.8% 30.2% 6.9% 13.8% 79.6% 2.1%
18.2%
COUNTRY
Imports (Millions USD)
Exports (Million USD)


