


 146 / 214

Improving Transnational Transport Corridors
In the OIC Member Countries: Concepts and Cases
132
4.6.3.
Economic factors
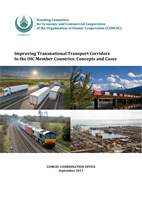
With respect to economic factors, an assessment of the following features has been prepared:
Economic Openness
Ease of doing business
Cost Structure
OIs for each country has been compiled with data for the table taken from the IMF, UN, OECD
and World Bank. It is apparent that land locked countries are generally less open than
maritime countries though not significantly so in NTTC partly due to the existence of long
established and well-functioning transport links to the ports.
Table 40: Openness of Countries in NTTC
Source: Fimotions (2017), compiled relates to the latest years from available databases, this may differ from other
sources.
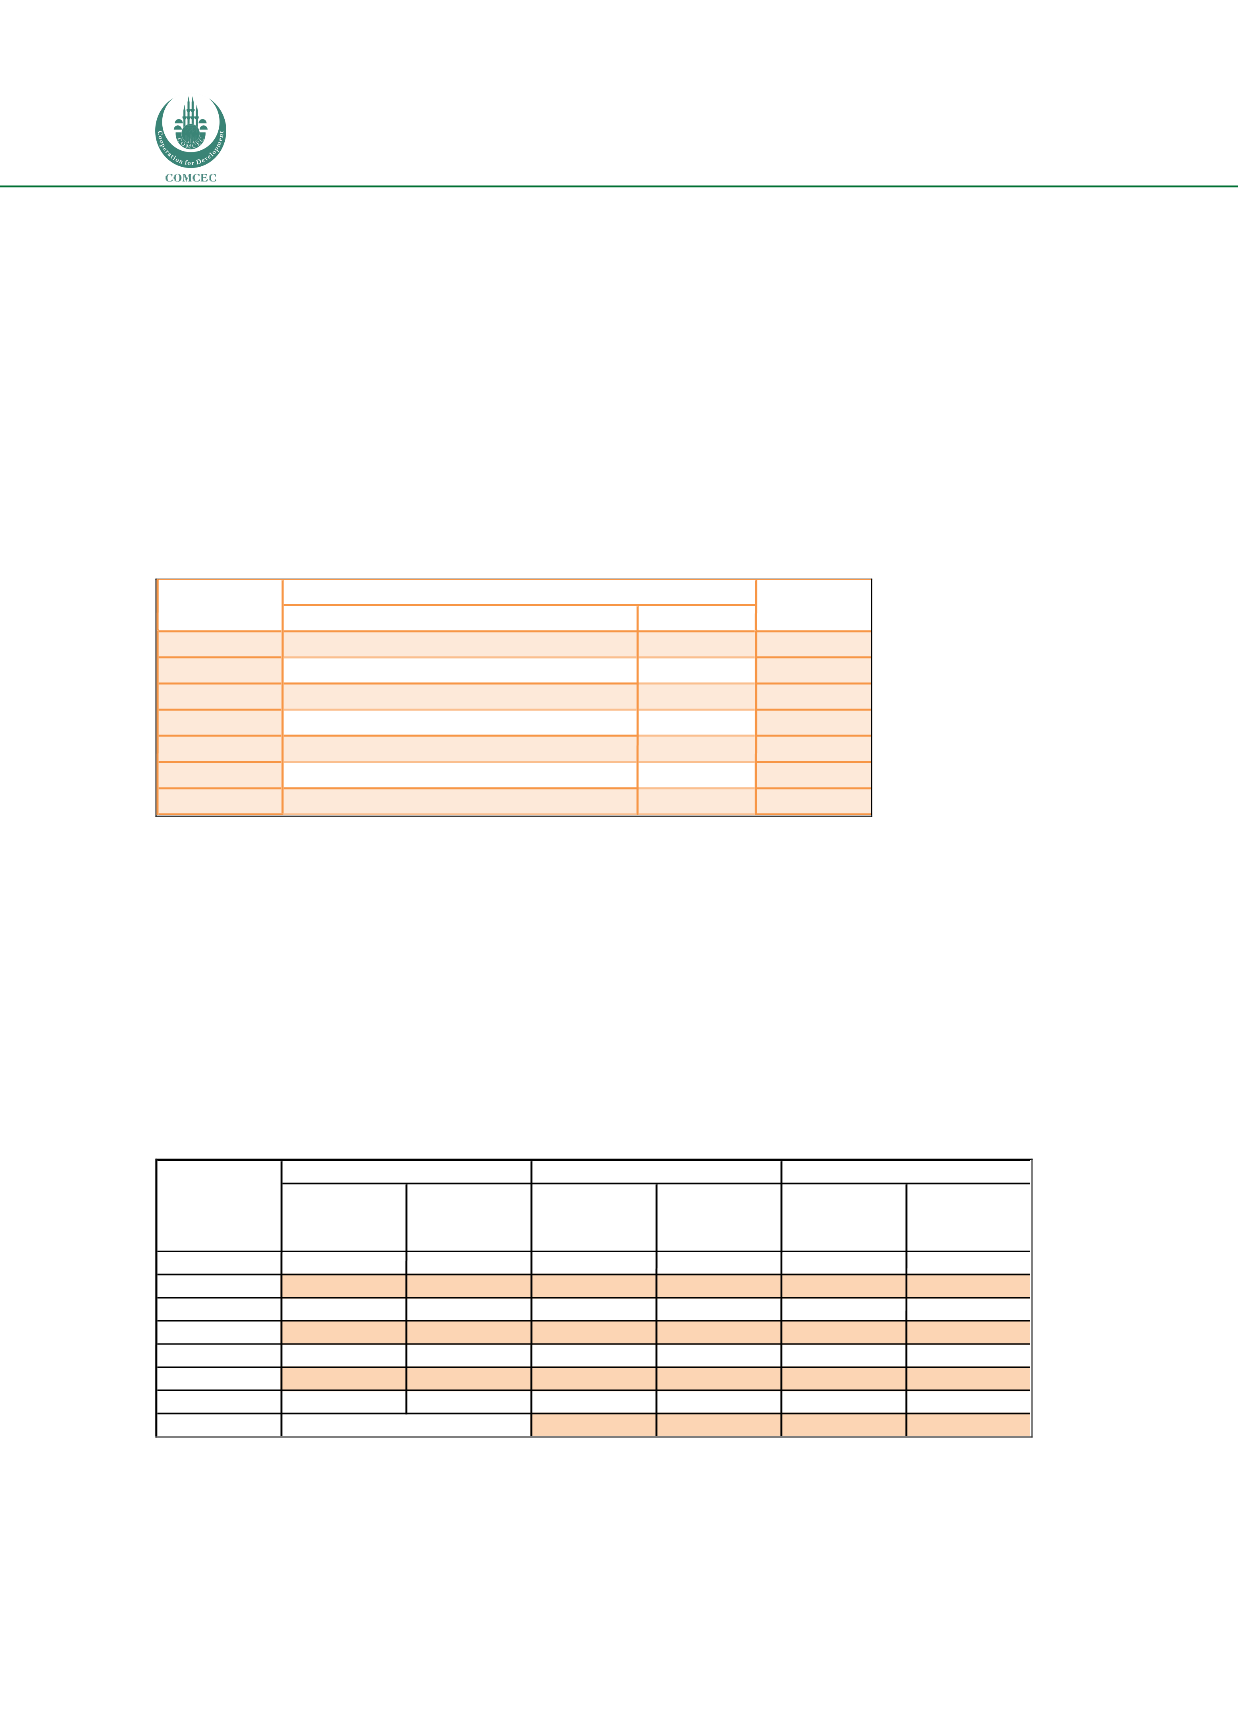
Corridor country data is compared with the global mean for 190 countries from the EODB
database. Trading across borders is a part of the index and most pertinent to the study. Export
processing times are extremely high in the DRC and in South Sudan – the latter expected as it is
a new country and in the former, may well reflect the level and state of national governance.
Costs of processing exports are very high in DRC and Tanzania and obviously affects the
viability of trade. Import processing data is also available but has not been included, the
analysis presupposing that export efficiency is more central to development.
Table 41: EoDB in corridor countries in 2017
Source: World Bank.
The Cost structure
to be investigated includes the cost of investment, labor, land, and energy,
the rationale being that improvements in political, economic and social cooperation along the
GDP
Imports Exports Total
UGAN
26,195
4,677
2,755
7432
28%
RWAN
8,406
1,961
538
2499
30%
BUR
3,133
683
122
805
26%
KENYA
68,919 14,700
5,679 20379
30%
DRC
41,615
5,640
5,690 11330
27%
S. SUDAN
9,000
426
12
438
5%
N. TANZ
47,184
9,976
5,365 15341
33%
Country
Openness
USD Millions
UGAN
115
136
71
287
64
102
RWAN
56
87
97
183
42
110
BUR
157
160
59
106
120
150
KENYA
92
105
21
143
19
191
DRC
184
515
2223
698
136
S. SUDAN
186
177
146
763
192
194
TANZ
132
180
96
1160
96
275
WORLD
59
411
56
149
Time to
export
(hours)
Cost to
export
(USD)
Country
Ranking
Border Compliance Documentary Compliance
Overall
Trading
across
borders
Time to
export
(hours)
Cost to
export
(USD)