


 135 / 214

Improving Transnational Transport Corridors
In the OIC Member Countries: Concepts and Cases
121
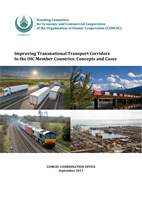
However, there is a growing interest in perpetuating trade relations across North Africa. The
Trade Matrix i
n Table 33shows that intra corridor trade to be small (6%) compared to trade
with the rest of the World. Tunisia and Mauritania appear to be trading at a higher level with
neighboring countries. This is also confirmed by the Ministry of Transport of Tunisia during
the study visit.
Libya’s high levels of exports are mostly of oil and gas. The potential for mutually beneficial
development through trade remains very great in Africa in general and through Maghreb, in
North Africa, in particular.
Table 33: Trade Matrix TAH1
Source: Fimotions (2017), analysis on data o
n www.trademap.org ,based mostly on 2016 data or nearest year.
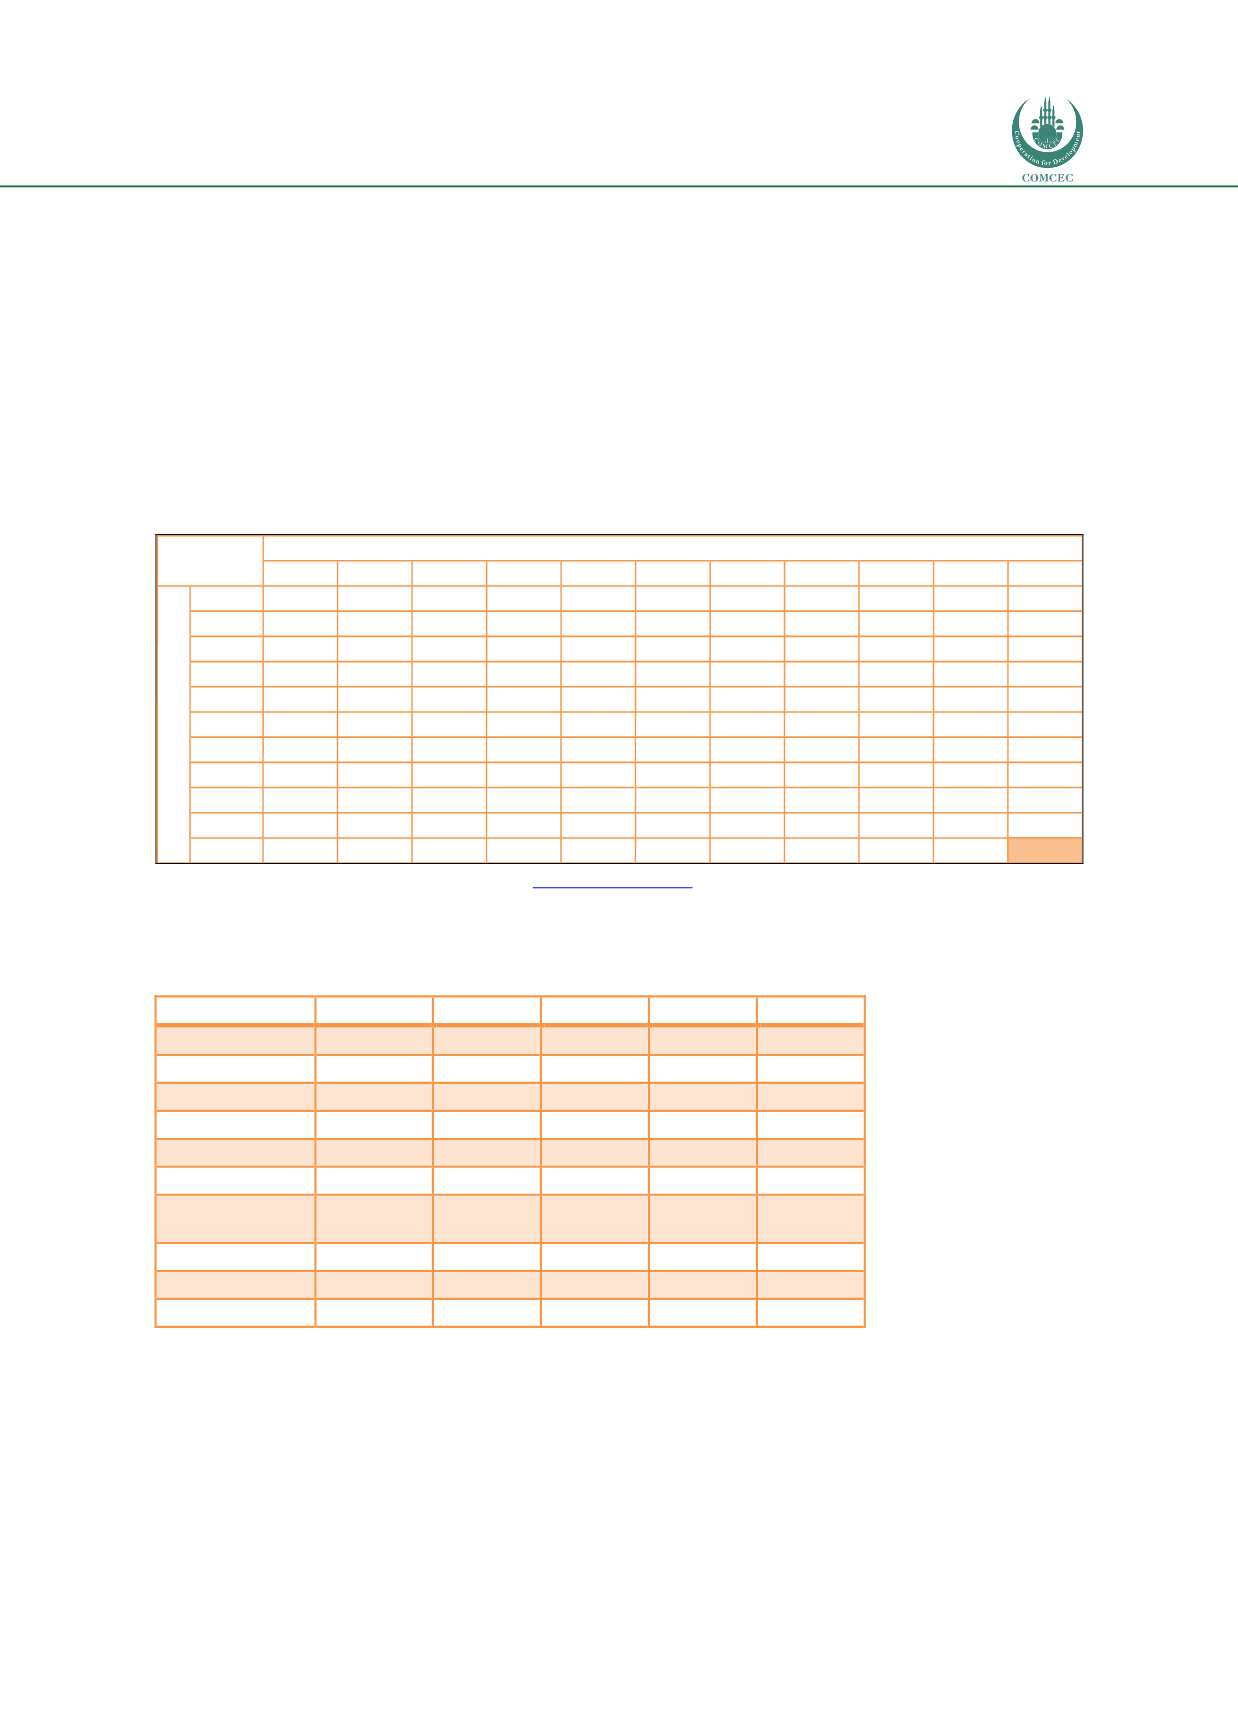
The LPIs for TAH1 countries have been analyzed for years 2007/2015 as shown i
n Table 34.Table 34: Logistics Performance Index countries in the TAH1
2007
2010
2012
2014
2015
All
2.74
2.88
2.89
2.88
2.88
Egypt
2.37
2.61
2.98
2.97
3.18
Libya
N/A
2.33
2.28
2.5
2.26
Tunisia
2.76
2.84
3.37
2.55
2.5
Algeria
2.06
2.36
2.41
2.65
2.77
Moroco
2.38
N/A
3.03
N/A
2.67
Western
Sahara
N/A
N/A
N/A
N/A
N/A
Mauritania
2.63
N/A
2.4
2.23
1.87
Senegal
2.37
2.86
2.49
2.62
2.33
Total
14.57
13
18.96
15.52
17.58
Source: Fimotions (2017), data source: World Bank.
One of the critical components of the LPI relates to customs procedures, which is below the
global averages for all countries except for Egypt. Lack of common customs documentation and
lack of sharing information for transiting goods leads to excessive delays and paperwork that
typifies poor trade facilitation. However, there is growing recognition of the need for higher
standards. When taken in total, there is an improvement collectively for all of the corridor
EGYPT LIBYA TUN ALG MOR W. SAHA MAU SEN Total
World
%
EGYPT
582
171
466
411
0
10
47
1,687 22,507
7%
LIBYA
68.3
19
8
89
0
0
2
186 8,584
2%
TUN
84.8
540
558
191
0
22
50
1,446 13,216
11%
ALG
303
22
810
236
0
57
8
1,436 28,812
5%
MOR
273
11
99
615
0
173
197
1,368 22,844
6%
W. SAHA
0
0
0
0
0
0
0
N/A 1,896
0%
MAU
2
0
2
0
211
0
3
218 1,723
13%
SEN
1
0
0
1
7
0
17
26 2,640
1%
Total
732 1,155 1,101 1,648 1,145
N/A 279
307 6367.1
World 58,052 6,763 16,796 45,129 48,681 2,207 2,283 5,478
102,222
%
1% 17% 7% 4% 2% 0% 12% 6%
6.0%
COUNTRY
Imports (Millions USD)
Exports (Million USD)