


 138 / 214

Improving Transnational Transport Corridors
In the OIC Member Countries: Concepts and Cases
124
12,000 near the capital to a 800 vehicles per day at the border. Senegal and Mauritania traffic
levels are less than 1,000 and only 50 at the border (SWECO, 2003).
TAH1 has proved to be used much more as for commuting and interurban traffic than
international traffic. It is unavoidable of course, but that direct access to this international
highway along peri-urban sections may have become too easy, due to lack of planning controls,
considerably reduces its integrity and value. Any office, warehouse, shop, garage, or even large
house wanting access to the main route, builds on an adjoining plot and constructs an access
road. During the study visit, the Tunisian Confederation of Industry, Trade and Handicrafts
(UTICA) as an industry representative indicated that this is the main challenge for transport
companies on this corridor: improper infrastructure. It causes devastating impacts on the
transport costs. This is also one of the reasons why Tunisia trades more with Europe. China is
actually investing heavily in logistic center projects in Africa (more than any other countries
like Russia and European countries), but the current infrastructure conditions hinder the
investment progress.
TAH1 has reduced journey times by road between the principal cities of each country as shown
in
Table 36which shows point to point and accumulated distances. The journey times prior to
the construction of the TAH1 on single carriageway roads typically would have been at least
50% slower with many more road accidents. In Tunisia, for example, section travel time (195
km) was 4 hours on single carriageway reduced to 2 hours on dual carriageway. Similarly,
accidents reduced from 0.47 deaths per accident to 0.27 deaths per accident
52
. The journey
times between cities have been obtained from on line route applications and may not be that
accurate. However, satellite imagery shows the route to have low levels of usage outside the
conurbations and so high average speeds would be possible. The accumulated actual travel
time Cairo to Dakar is 113 hours – add to this the average border processing time at 14 border
crossings of 3 hours each, the total transit time is more of the order of 155 hours.
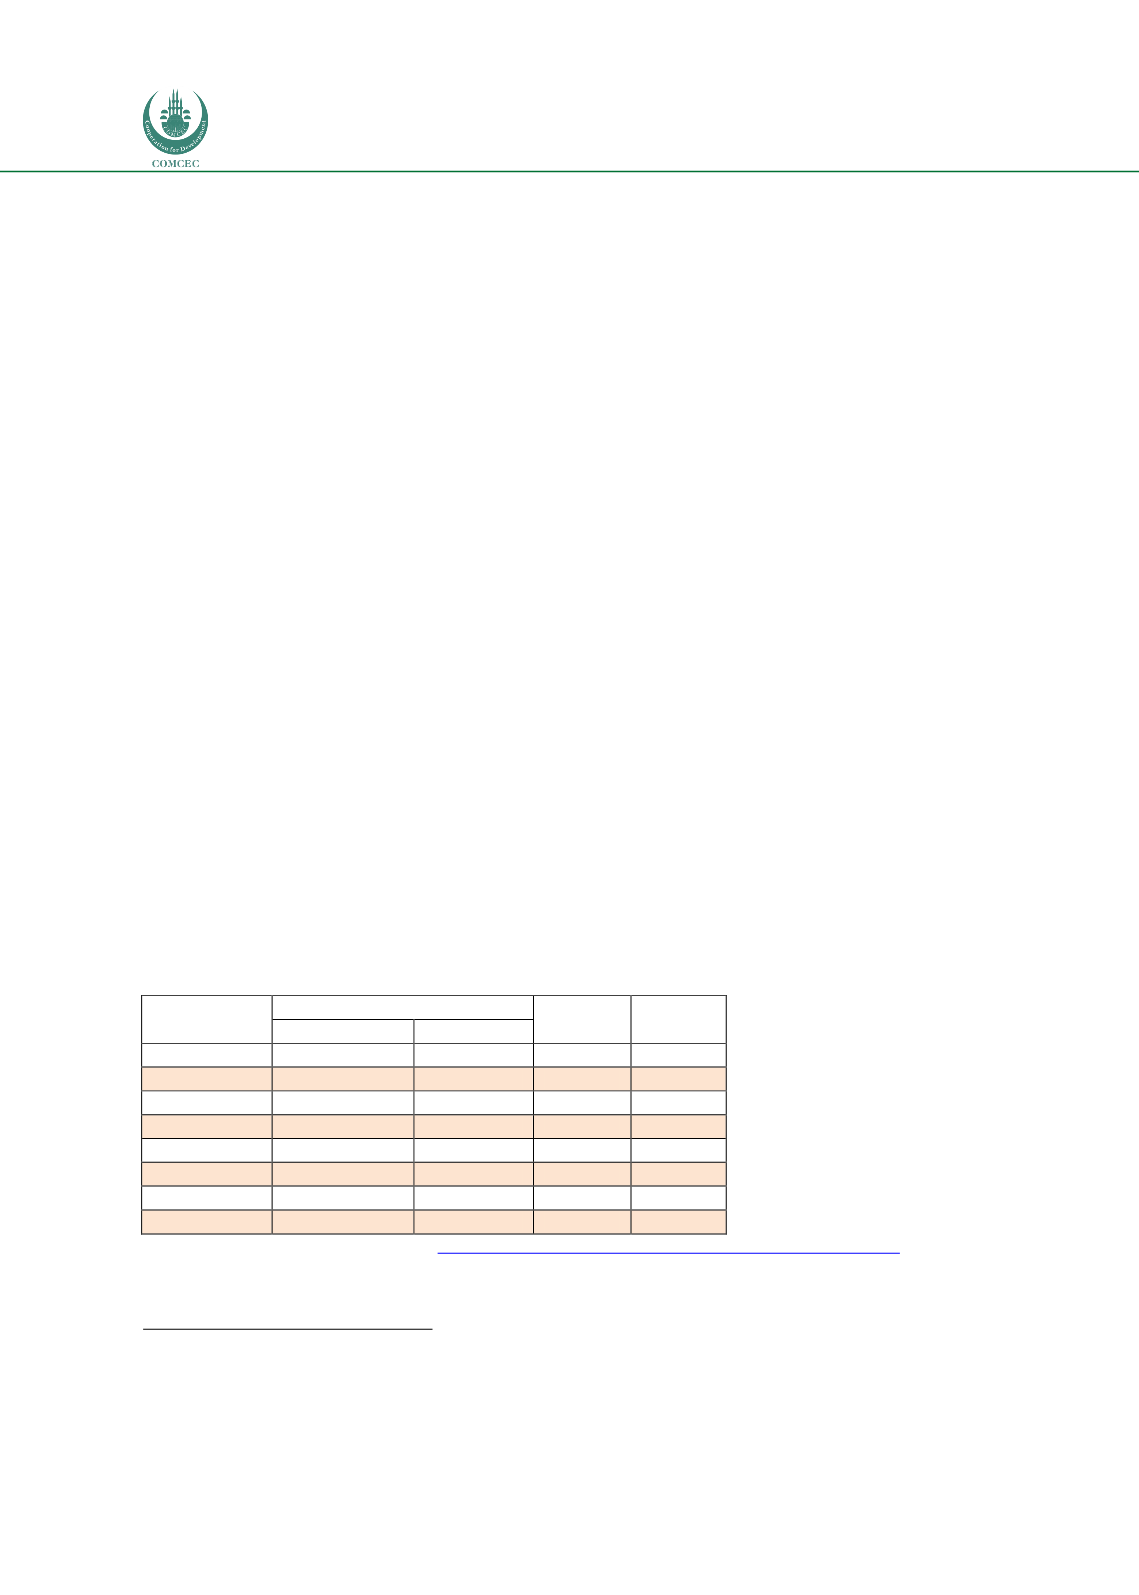
Table 36: Distance and journey times between cities
Country
Distance (km)
Time
(hours)
Speed
(kph)
City to City
Corridor
Cairo
0
0
0
0
Tripoli
2044.81
2044.81
24.5
83.5
Tunis
772.52
2817.33
9.6
80.5
Algiers
797.52
3614.85
10.5
76
Rabat
1423.53
5038.38
23
61.9
El-Aaiún
1167.85
6206.23
13.6
85.9
Nouakchott
1280.8
7487.03
14.75
86.8
Dakar
549.51
8036.54
7.6
72.3
Source: Fimotions (2017), data source
: http://www.worldatlas.com/travelaids/driving_distance.htm .52
https://www.afdb.org/fileadmin/uploads/afdb/Documents/Project-and-Operations/TUNISIA_-_Gabes-Medenine-Ras_Jedir_Highway_Construction_Project_.pdf