


 176 / 205

Sustainable Destination Management
Strategies in the OIC Member Countries
164
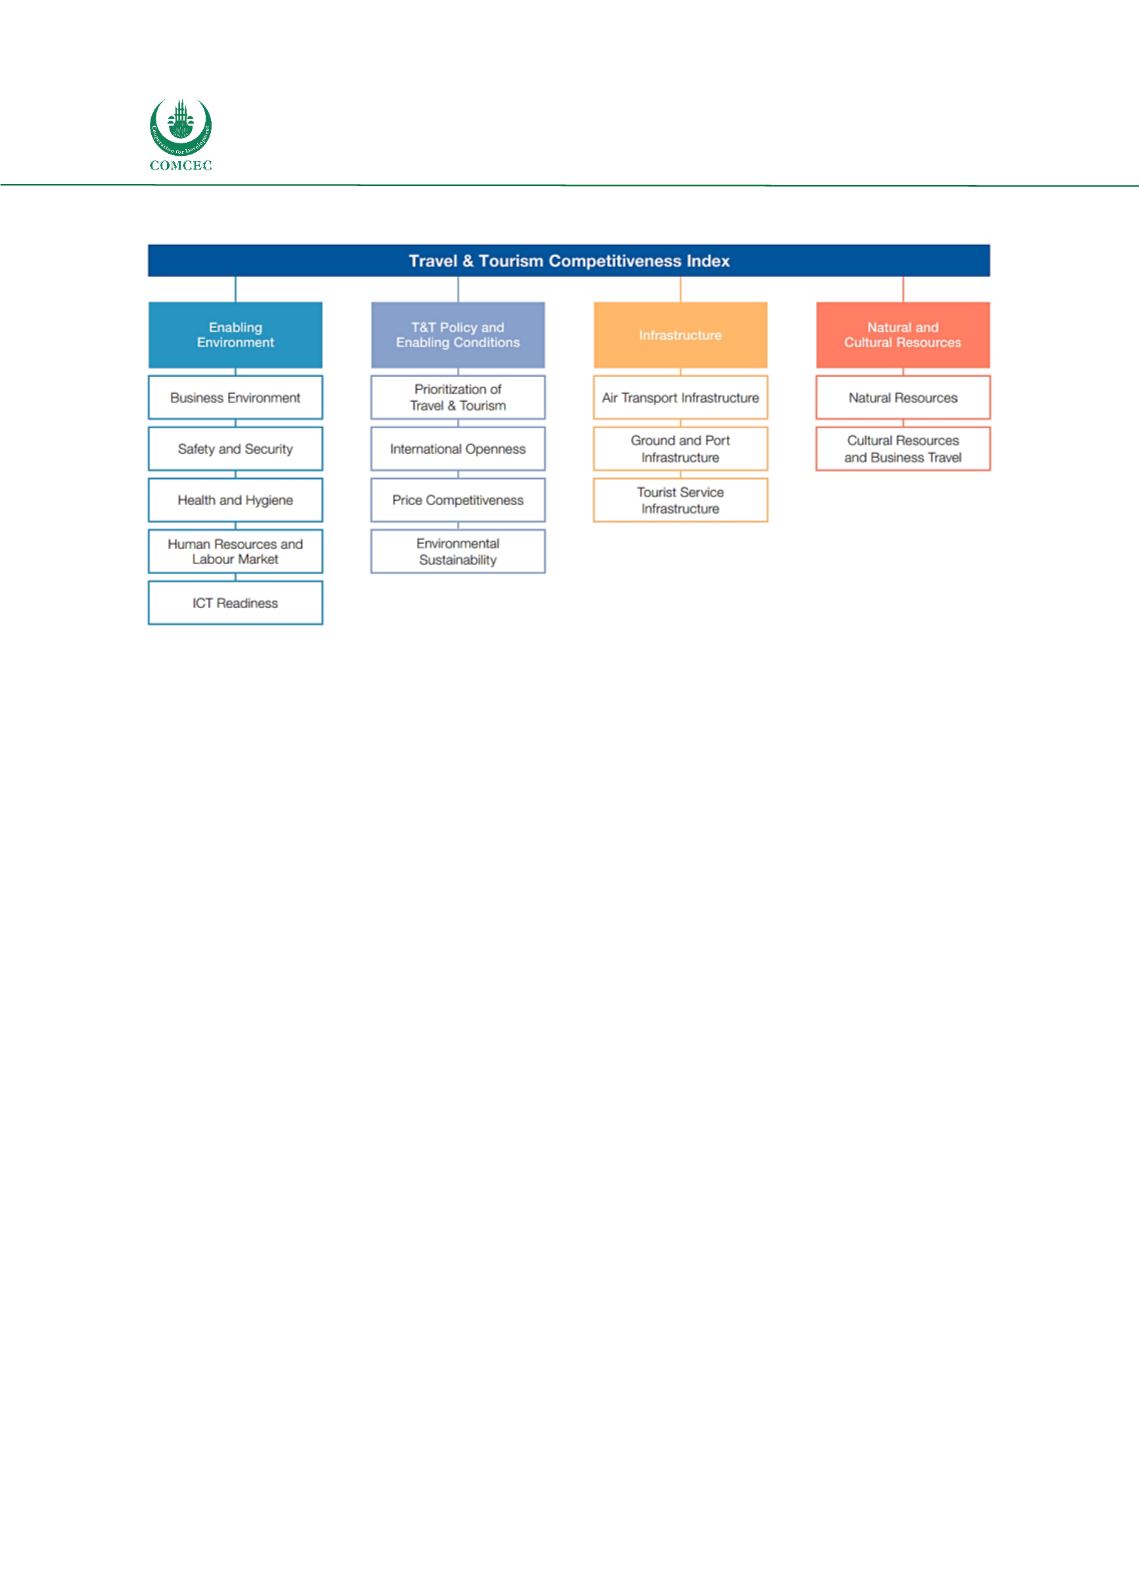
Figure 47: The Travel & Tourism Competitive Index 2019 Framework
Source: World Economic Forum Travel & Tourism Competitiveness Report 2019
5.3.
Assessing the Indicators
By combining indicators and comparing countries within a tourism corridor, differences in
their positioning and required policies become apparent. The below graph shows the
differences. The scatter graph shows differences particularly in the regions between the OIC
countries. The radar graph shows the differences between specific indicators within one
corridor.
With the scatter graph, in this case, we can determine countries that are tourism ready and
open, tourism ready and closed, not tourism ready and open, and not tourism ready and closed.
In this case, it can generally be observed that Sub-Saharan members of the OIC are less tourism
ready and tend to be less open whereas Middle Eastern and North African countries tend to be
more tourism ready but still relatively closed.
As an example, we can assess the Holy Family Corridor with Egypt and Jordan. Jordan is lower
on the Tourism Readiness Index than Egypt. This shows that policies to improve Jordan’s
tourism readiness overall are required, and Egypt could help with the knowledge transfer. It
also shows that Jordan would overall benefit from a joint corridor through gaining more
tourism from Egypt.
Egypt is lower on the Openness Index, which means that a corridor involving both countries
would overall be measured through Egypt’s openness. Some policies might be required to
facilitate cross-border travel to enhance the corridor.
The radar graph shows that Turkey is higher on the infrastructure index and can assist other
countries with knowledge exchange, whereas Azerbaijan leads in the safety and security index,
which should make it the perfect example in the corridor within this sphere.