
Facilitating Trade:
Improving Customs Risk Management Systems
In the OIC Member States
134
Technology
Turkey
TCA CRM is using advanced IT tools for analysis of the risk profiles/indicators. The
integrated customs data warehouse (GUVAS) is allowing the CRM to monitor and measure
the effectiveness of the CRM processes. Currently, there is an ongoing project for
implementation of data mining concept in TCA.
Senegal
Senegalese Customs is currently integrating the GAINDE Intégrale CDPS and other
supportive systems for management of all internal customs procedures in customs
clearance offices, exchanging permits and certificates managed by the SW and TAME for
risk analysis, targeting and risk guidance.
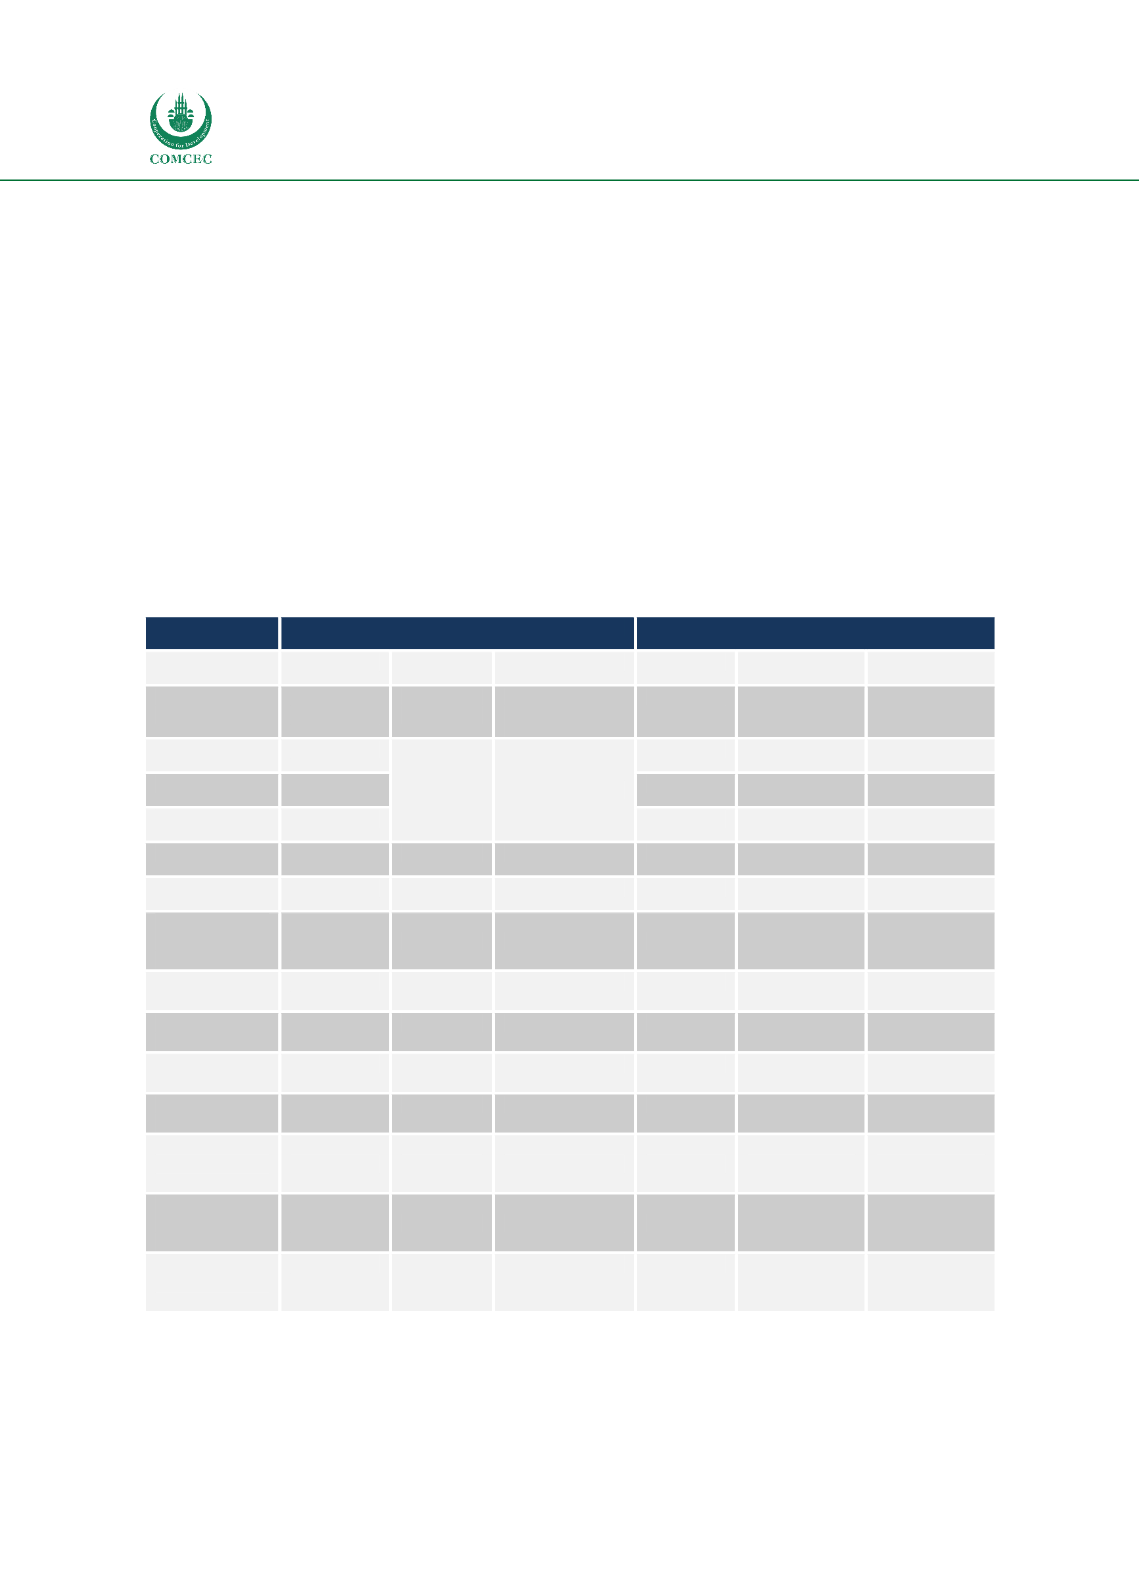
Table 37 presents the performances of the non OIC and OIC MS and the costs and time for import
and export according to the WB Trading Across Border indicators.
Table 37: Performances of the Global Best Cases and OIC MS
Global Best Cases
OIC Case Countries
Country
Kosovo
Australia
New Zealand
Turkey
Senegal
Albania
Volume of
Export/Import
263478
declarations
5250000
entries
14.4 mil.
Transactions
/
230236
declarations
539563
Declaration
% of Green
20.32%
59.80%
99.15%
/
3.70%
% of Blue
0.78%
/
0.00%
% of Yellow
56.63%
/
82.09%
% of Orange
/
40.00%
0.52%
/
6.11%
% of Red
22.27%
0.20%
0.33%
/
10.13
Success Rate
Physical
Inspection
1.99%
4.17%
4.06%
/
0.92%
Time to Import
(in hours)
22
43
26
52
125
10
Time to Export
(in hours)
66
43
40
21
87
9
Cost to Import
(in US$)
170
625
447
797
1247
77
Cost to Export
(in US$)
232
1013
404
463
643
55
RA on Pre-
Arrival
Information
Yes
Yes
Yes
Yes
Yes
Yes
RA on Pre-
Departure
Information
No
Yes
Yes
Yes
Yes
No
CRM System in
Use (Integrated,
Embedded)
Integrated
Integrated
Integrated
Integrated
Embedded &
Integrated
Embedded
As can be seen from the comparative table, developed countries as Australia and New Zealand
have very low percentage of customs declaration on physical control, 0,20% and 0,33%
respectively compared with 10,13% physical inspection in Albania. Even they have lower rates
of a physical inspection; the success rates of inspection are much higher.


