


 162 / 236

Preferential Trade Agreements and Trade Liberalization Efforts in the OIC Member States
With Special Emphasis on the TPS-OIC
138
and practices attributable to member States and WAEMU Commission with certain
enforcement powers (WTO, 2010a). Furthermore, there are common agricultural, industrial
and several other policies. The assessment of progress in actual implementation of these
ambitious integration initiatives is difficult.
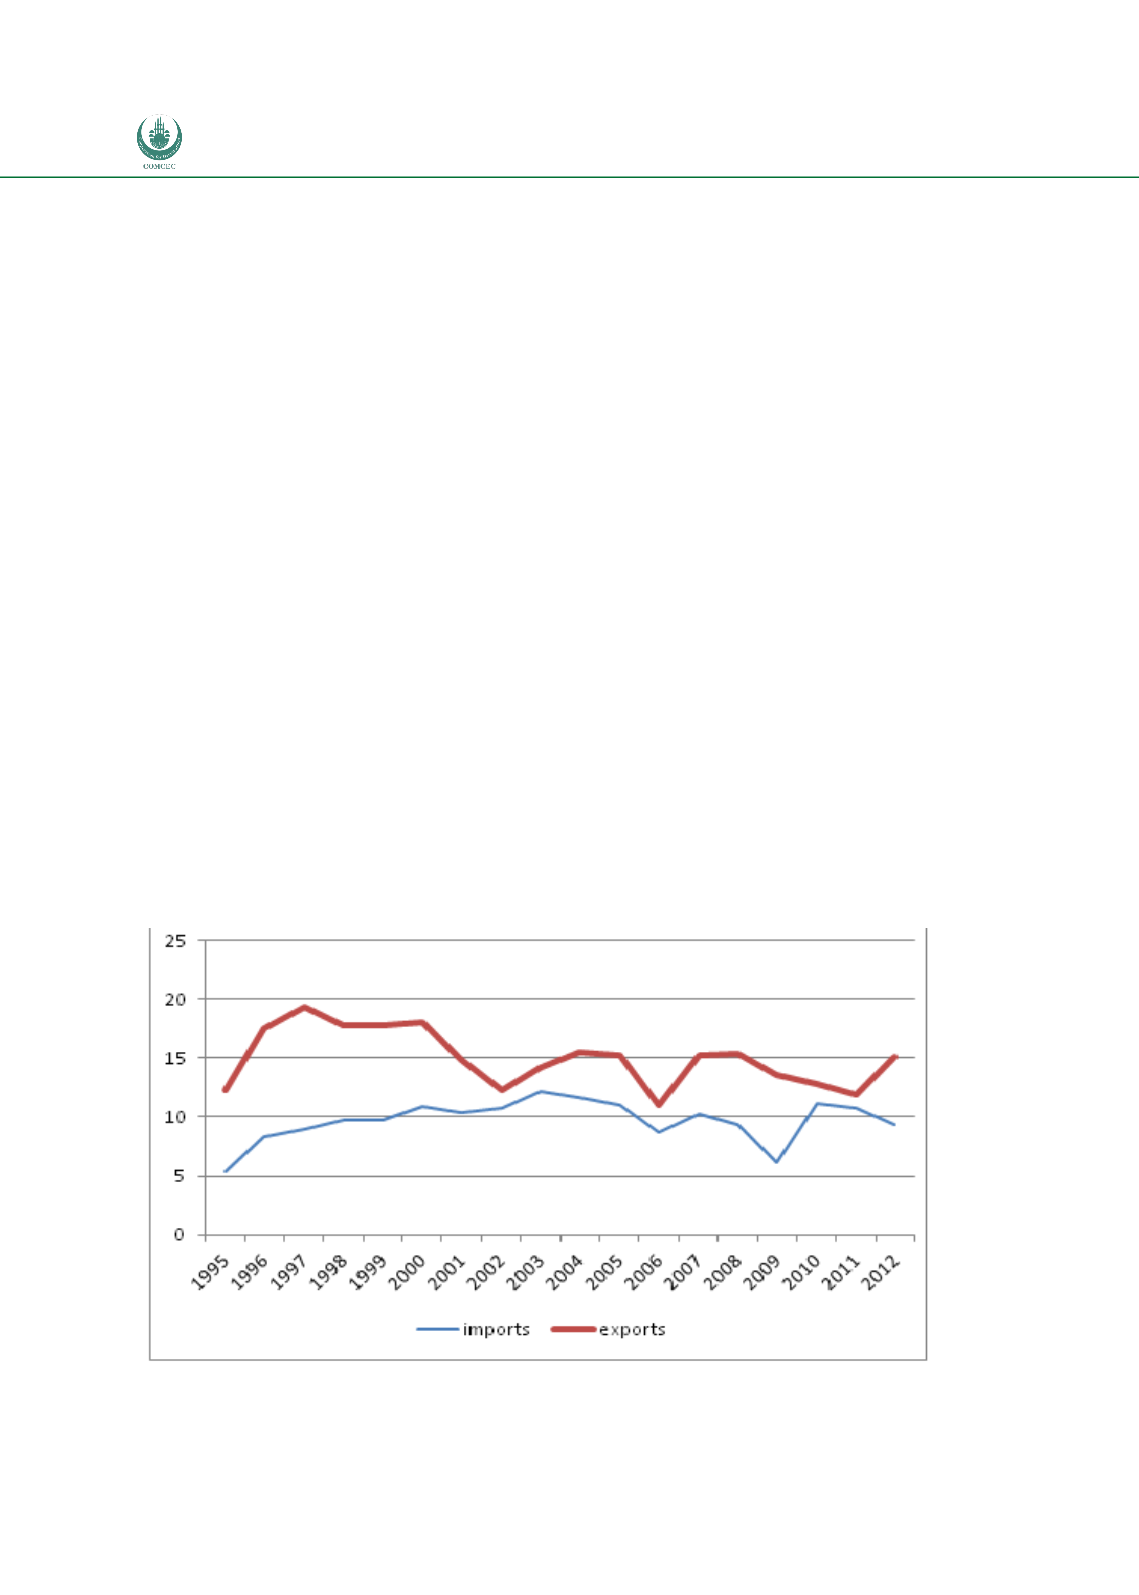
The share of intra-WAEMU trade in total trade of the block has been broadly stable since mid-
1990s at around 10% of imports and just below 15% of exports. This still represents a high
share of intraregional trade compared to other African regions (Goretti and Weisfeld, 2008).
Levels and trends among individual countries differ. For instance Mali re-oriented its exports
away from WAEMU in 2000s, while Togo has seen a strong relative growth of exports to its
WAEMU partners in recent years. On the imports side, Mali is most integrated with its WAEMU
partners sourcing around 40% of its total imports from there. WAEMU share in imports of
Burkina Faso, Benin and Niger ranged between 10% and 20% in recent years. In contrast,
WAEMU accounts for a very small share of imports of Senegal, Togo and Cote d’Ivoire. (Note:
data for Guinea-Bissau are largely missing not allowing a meaningful presentation. Gaps in
data coverage suggest caution in interpretation of figures.)
Petroleum oils (HS271000) accounted for almost half (47.6%) of total intra-WAEMU trade in
2011. Portland cement (HS252329) accounted for 11.7% and palm oil (HS151190) for 4.5% of
intra-WAEMU trade. Concentration of some countries’ exports to their WAEMU partners has
decreased since mid-1990s, especially in the case of Mali, Niger and Burkina Faso as suggested
by the evolution of trade concentration plotted in Figures 67 and 68 below). For other
countries there are no clear trends in concentration of intra-customs union exports.
Figure 59:
Share of Intra-FTA Trade for WAEMU as Share of Total Trade
Calculations based on Comtrade data