


 126 / 236

Preferential Trade Agreements and Trade Liberalization Efforts in the OIC Member States
With Special Emphasis on the TPS-OIC
102
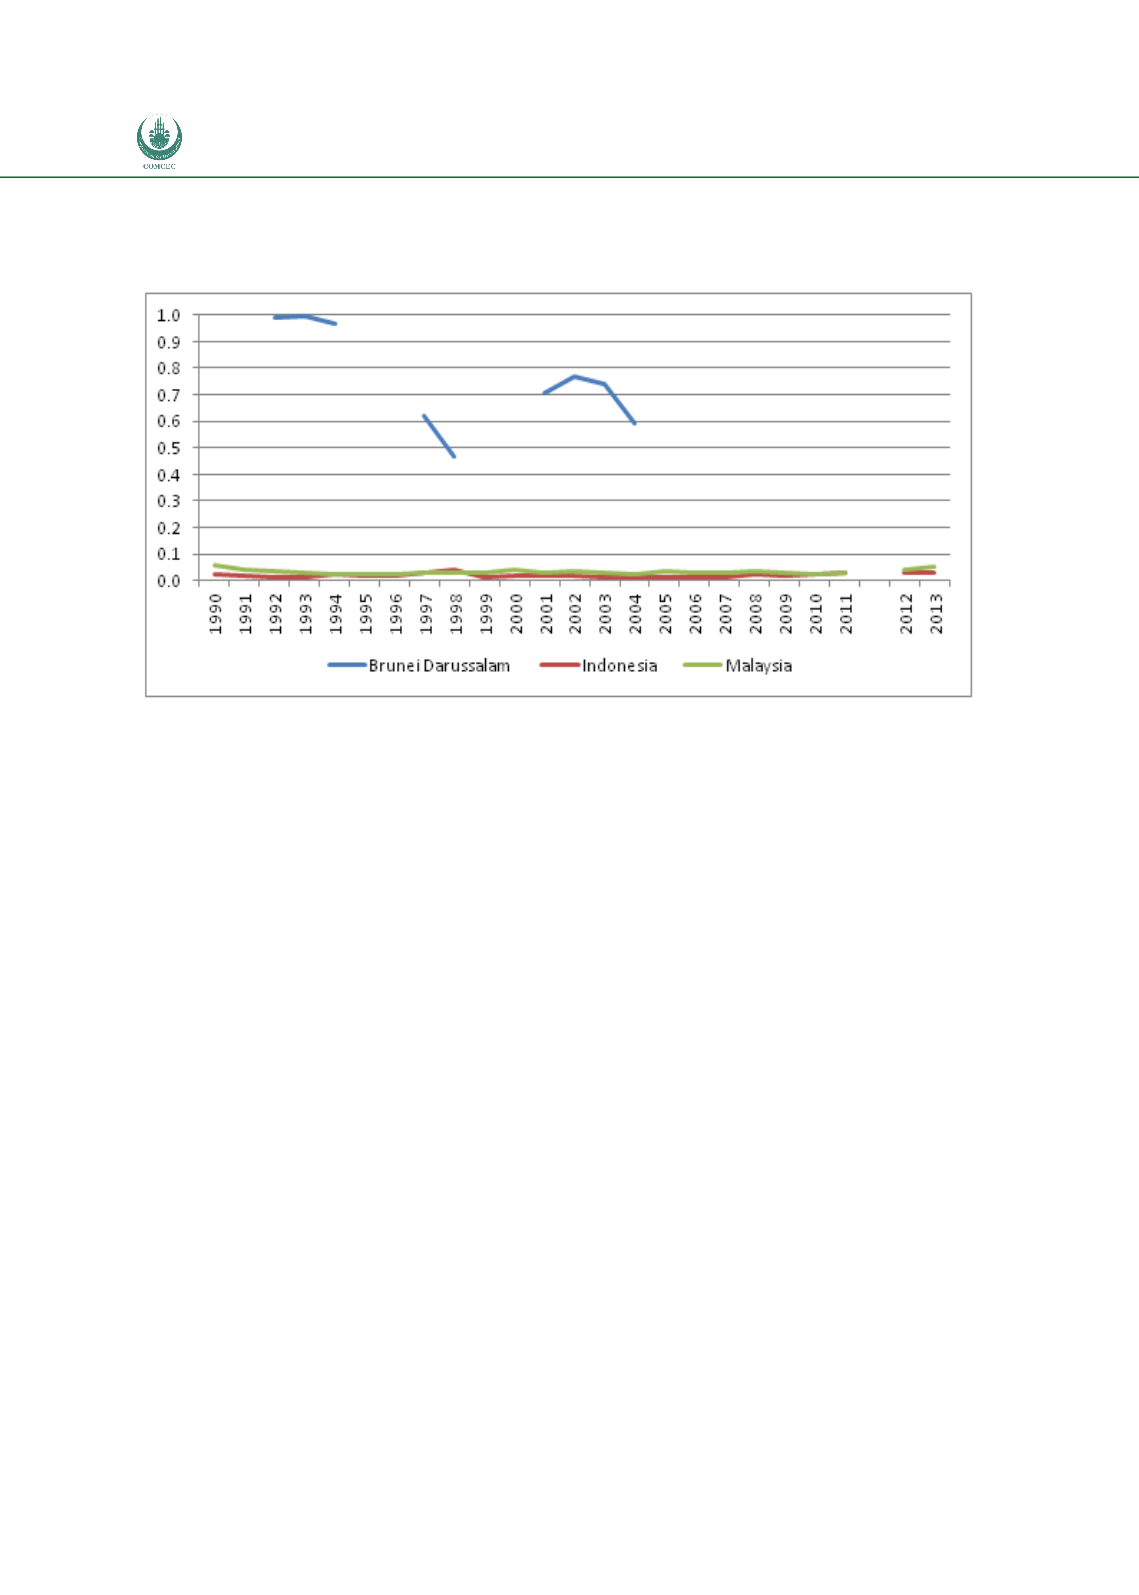
Figure 23: Index of Concentration of ASEAN OIC Countries’ Exports to ASEAN (higher values
indicate more concentrated exports / imports), 1990-2013
Source: Calculations based on Comtrade data
Trade concentration index (TCI) by product is defined as TCIij = SUMk (xij / Xij)2 where i, j denote
countries xij are in this case exports of country i to country j of product k and Xij denotes total
exports of country i to country j. The index ranges between 0 and 1 with lower values indicating
more diversified trade (export) structure.
Okabe and Urata’s (2013) empirical analysis of intra-ASEAN trade flows at the sectoral level
utilising annual tariff data finds trade-creation effects in the majority of sectors, especially on
the side of imports. Among ASEAN members these effects are relatively stronger for Indonesia
and Malaysia. The authors speculate that this may be partially explained by lower utilisation
of preference by new ASEAN members given that it takes time to learn about the presence of
AFTA / ATIGA. There are, however, no comparable data on utilisation that could back this
hypothesis. Another intuitive but important observation in Okabe and Urata (2013) is that
NTMs appear to limit the trade effects of tariff eliminations: sectors where there are more
NTMs see somewhat lower estimated coefficient of trade response to tariff reductions.
Increasing intra-ASEAN import shares in intermediate and capital goods that was visible
during 1990s can be viewed as reflecting the formation of production networks in ASEAN.
Specifically, Okabe and Urata’s (2013) calculations suggest a rise of the share of intra-ASEAN
imports in capital goods from 7-8% in late 1980s to 15% and above starting from late 1990s.
In the case of imports of parts and components the respective increase of intra- ASEAN import
share was from around 15% in late 1980s to 22-25% in the late 1990s and 2000s.
ATIGA also foresees action on elimination of several non-tariff measures (NTMs). Parties of the
agreement commit to transparency of any new NTMs by maintaining the database that is also
to be included in the ASEAN Trade Repository, a publicly available on-line repository